Figures & data
Figure 1. Polyquaternium (PQ) chemical structure, trade name and code.
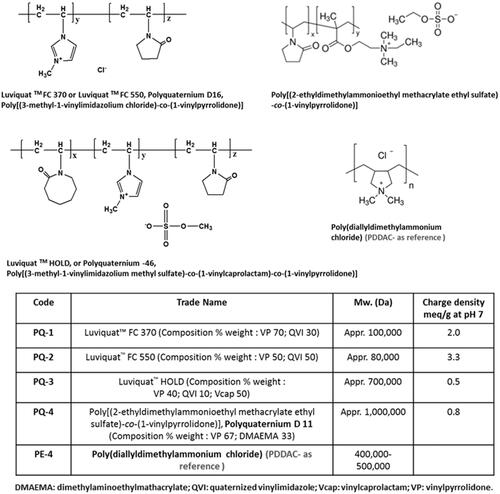
Figure 2. Cell viability of C2C12E50 myoblasts after treatment with PQs at 5 doses (4, 10, 20, 50 and 100 μg/mL for each polymer; PEI 25k is used as control) determined by MTS assay. Cells were seeded in 96-well plate at an initial density of 1 × 10⁴ cells/well in 0.2 mL growth media. The results are presented as the mean ± SEM (n = 3, two-tailed t-test, *p ≤ .05 compared with untreated cell).
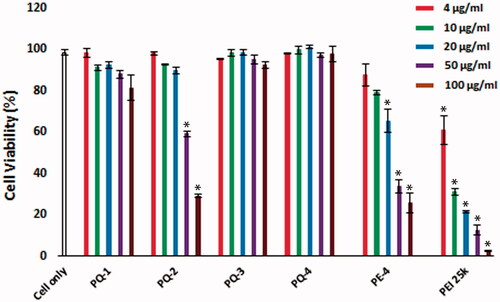
Figure 3. Delivery efficiency and toxicity of PMOE50/PQs complexes in C2C12E50 cell line determined by fluorescence microscope and FACS analysis. (A) Representative fluorescence images of PMO-induced exon-skipping in C2C12E50 cell line. The images were taken after three-day treatment, and original magnification: ×200. (B) Transfection efficiency of PMOs formulated with PQs (two-tailed t-test, *p ≤ .05 compared with PMO only). (C) Cell viability (two-tailed t-test, *p ≤ .05 compared with untreated cell as control). (D) Flow cytometry histogram (FL) of PMOE50/PQs complexes. In this test, PMOE50 (10 μg/mL) was formulated with PQs (4, 10, 20, 40, 100 and 200 μg/mL for each polymer), and Endoporter (4, 10, 20 μg/mL) formulated as control in 0.5 mL 10% FBS-DMEM medium, respectively. The results are presented as the mean ± SEM in triplicate.
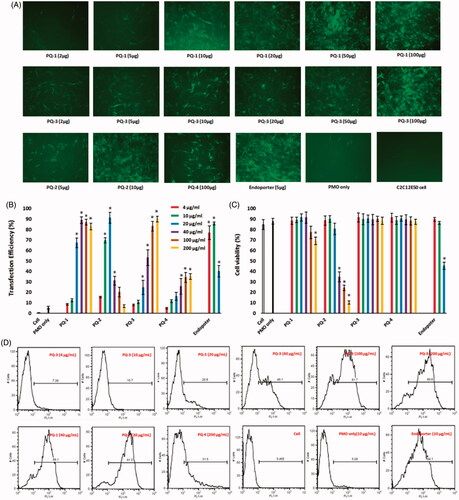
Figure 4. Restoration of dystrophin in TA muscles of mdx mice (aged 4–5 weeks) 2 weeks after i.m. injection. [The samples were from muscles treated with PQs (20 μg) and PMOE23 (2 μg) in 40 μL saline, PMOE23 only treated as controls]. (A) Dystrophin was detected by immunohistochemistry with rabbit polyclonal antibody P7 against dystrophin. Blue nuclear staining with DAPI, and original magnification: ×100. (B) The percentage of dystrophin-positive fibers in muscles treated with PQs formulated with PMOE23 (n = 5, two-tailed t-test, *p ≤ .05 compared with PMO alone). (C) Detection of exon 23 skipping by RT-PCR. Total RNA of 100 ng from each sample was used for amplification of dystrophin mRNA from exon 20 to exon 26. The upper bands (1093 bp, indicated by E22 + E23 + E24) correspond to the normal mRNA, and the lower bands (880 bp, indicated by E22 + E24) correspond to the mRNA with exon E23 skipped. (D) Western blots demonstrate the expression of dystrophin protein. Dys, dystrophin detected with monoclonal antibody Dys 1. α-Actin was used as loading control.
![Figure 4. Restoration of dystrophin in TA muscles of mdx mice (aged 4–5 weeks) 2 weeks after i.m. injection. [The samples were from muscles treated with PQs (20 μg) and PMOE23 (2 μg) in 40 μL saline, PMOE23 only treated as controls]. (A) Dystrophin was detected by immunohistochemistry with rabbit polyclonal antibody P7 against dystrophin. Blue nuclear staining with DAPI, and original magnification: ×100. (B) The percentage of dystrophin-positive fibers in muscles treated with PQs formulated with PMOE23 (n = 5, two-tailed t-test, *p ≤ .05 compared with PMO alone). (C) Detection of exon 23 skipping by RT-PCR. Total RNA of 100 ng from each sample was used for amplification of dystrophin mRNA from exon 20 to exon 26. The upper bands (1093 bp, indicated by E22 + E23 + E24) correspond to the normal mRNA, and the lower bands (880 bp, indicated by E22 + E24) correspond to the mRNA with exon E23 skipped. (D) Western blots demonstrate the expression of dystrophin protein. Dys, dystrophin detected with monoclonal antibody Dys 1. α-Actin was used as loading control.](/cms/asset/75d18cef-351a-43cf-9b42-5f689500836d/idrd_a_1337827_f0004_c.jpg)
Figure 5. Restoration of dystrophin expression after two-week systemic delivery of PMO with PQs in mdx mice (aged 4–5 weeks). Each mouse was injected with 1 mg PMOE23 with and without PQs (0.5 mg). (A) Dystrophin was detected by immunohistochemistry with rabbit polyclonal antibody P7 against dystrophin. Blue nuclear staining with DAPI, and original magnification: ×100. (B) Percentage of dystrophin-positive fibers in different muscle tissues (mean ± SEM, n = 5, two-tailed t-test, *p ≤ .05 compared with 1 mg PMO only). (C) Detection of exon 23 skipping by reverse transcription polymerase chain reaction. Total RNA of 100 ng from each sample was used for amplification of dystrophin mRNA from exon 20 to exon 26. The upper bands correspond to the normal mRNA, and the lower bands correspond to the truncated mRNA with exon E23 skipped. (D) Western blots demonstrate the expression of dystrophin protein from treated mdx mice in comparison with C57BL/6 and untreated mdx mice (20 μg of total protein was loaded for PQ-formulated PMO, PMO-treated mice, WT C57 and control mdx. A: TA; I: Diaphragm; J: Heart). Dystrophin detected with monoclonal antibody Dys 1. α-Actin was used as the loading control.
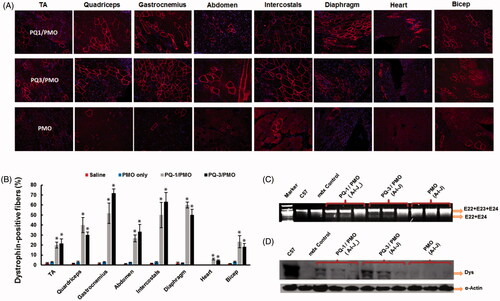
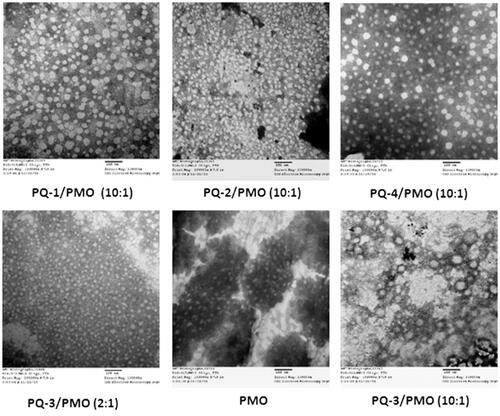
Figure 6. Negatively stained TEM images of PQs complex with PMO (the polymer/PMO polyplex solution containing 1 μg of PMO at a weight ratio of 10/1 or 2/1 (PQ/PMO) in 100 μL 0.9% saline. Direct magnification: ×130,000, scale bar: 100 nm).