Figures & data
Figure 1. Experimental flowchart. Human prostate cancer cells (LNCaP) were cultured and resuspended in ice-cold Matrigel (1:1) at a final concentration of 3x10⁶/0.1 ml. Mice were inoculated in each flank with LNCaP and subjected to cryopass-laser treatment (with 4 mg/kg melatonin or vehicle) three times/week, for 6 weeks, for a total of 18 treatments. At the end of the experimental time, tumors and blood were collected for the biochemical analysis.
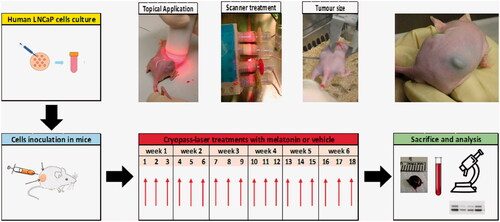
Figure 2. Body weight and tumor volume changes. (A) Time course of body weight of mice treated with melatonin or vehicle. (B) Time course of tumor volume in mice treated with melatonin or vehicle. Tumor volume was calculated as length x width x height x 0.5236 by a caliper. (C) Tumor volume at day 42. Data are expressed as the ratio (tumor volume)/(body weight) to compensate different rates of body growth in the experimental groups. Data are expressed as mean ± SEM, *p < .05 for treatment factor (Two-way ANOVA).
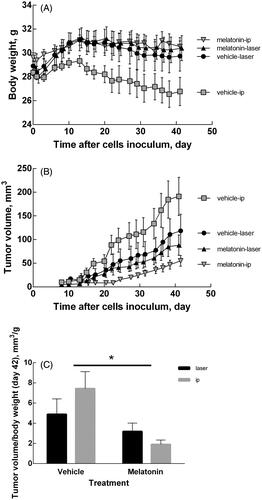
Figure 3. Plasma measurements. (A) Melatonin content in plasma at day 42 of mice treated with melatonin or vehicle. (B) Oxidant capacity in plasma determined measuring Reactive Oxygen Metabolites (ROMs) and expressed as H2O2 equivalents. (C) Plasma antioxidant capacity expressed as Trolox equivalents. Data are expressed as mean ± SEM, *p < .05 for treatment factor (two-way ANOVA).
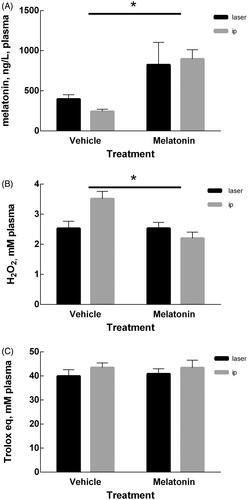
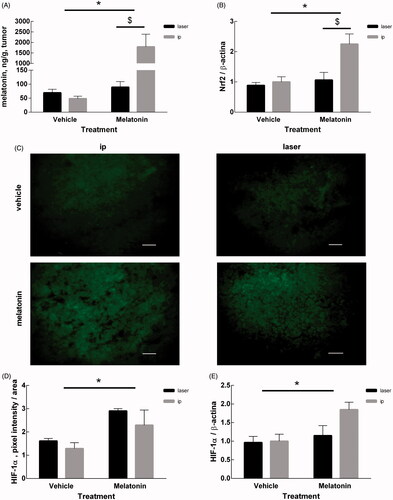
Figure 4. Measurements in tumor mass. (A) Melatonin content in tumor of mice treated with melatonin or vehicle, determined by competitive enzyme immunoassay as described in the Methods section. (B) Expression of Nrf2 protein measured by Western Blot. The intensity of Nrf2 bands were quantified and expressed as ratio with the intensity of β-actin bands. (C) Representative microphotographs of HIF-1α marked by immunofluorescence of all the experimental groups considered. The bars represent 50 μm. (D) Quantification of the HIF-1α signal measured as the sum of green pixels intensities exclusively in the tumor area, without considering the inflammatory infiltrate area. (E) Expression of the HIF-1α protein measured by Western Blot. The intensity of HIF-1α bands were quantified and expressed as ratio with the intensity of β-actin bands. Data are expressed as mean ± SEM, *p < .05 for treatment factor (Two-way ANOVA) and $p < .05 for delivery route factor.