Figures & data
Figure 1. (A) Schematic diagram of conjugation of DSPE-PEG2000-BR2; (B) MALDI-TOF/TOF mass spectra of the DSPE-PEG2000-Mal and (C) MALDI-TOF/TOF mass spectra of the synthesized DSPE-PEG2000-BR2. (D) Effect of BR2 peptide on the cellular uptake of cou6-labeled BR2-modifed liposomes by HepG2 cells after incubation for 3 h at 37 °C. The auto-fluorescence of the cells was applied as control. Data presented as the mean ± SD, n = 3. *p < .05 when compared to Lp/cou6 group. (E) The variations in particle size of Lp/CTD and BR2-Lp/CTD follow the incubation time at 37 °C. The initial CTD concentration was 10 μM in different liposomes and equal volume of FBS was added. (F, G) Representative particle size distribution profile of Lp/CTD and BR2-Lp/CTD.
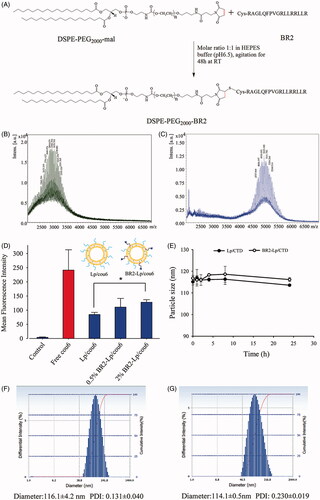
Figure 2. The cytotoxicity of various CTD formulations toward HepG2 (A) and normal hepatocytes Miha cells (B) by MTT assay. The cells were treated 24 h respectively with blank Lp, Lp/CTD, BR2-Lp/CTD and free CTD with indicated concentrations of CTD (10-100 μM). *p < .05 for BR2-Lp/CTD sample and Lp/CTD treatment groups. Lower panels (C) show the morphologies of HepG2 and Miha cells after incubated with CTD formulations at 10 μM for 24 h.
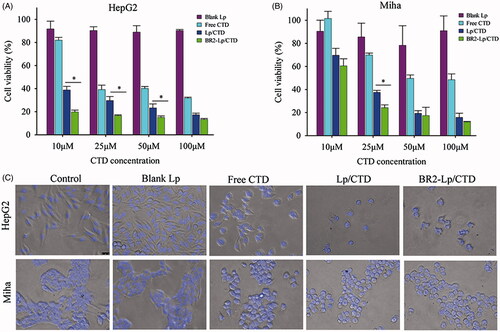
Figure 3. (A) Cellular uptake of coumarin-6 labeled Lp and BR2-Lp by HepG2 cells and normal hepatocytes Miha cells. Both cells were treated with Lp and BR2-Lp at 0.1 μg/ml cou6 for 3 h at 37 °C, respectively. Cell nuclei were stained blue with Hoechst 33342. Coumarin-6 was shown as green fluorescence (Scale bar 100 μm). The images were taken by fluorescent microscope. (B) Mean fluorescence intensity of cells after incubation with BR2-Lp/cou6 for 3 h at 37 °C by flow cytometry. The data presented as the mean ± SD, n = 3. *p < .05. (C) Intracellular distribution of cou6-loaded BR2-Lp at 0.1 μg/ml Cou6 concentration in HepG2 cells after 0.5 and 3 h incubation. BR2-Lp was represented in green fluorescence. Cell nuclei and endosomes/lysosomes were counterstained with Hoechst 33342 (blue) and LysoTracker Red (red), respectively. The scale bar represents 100 μm.
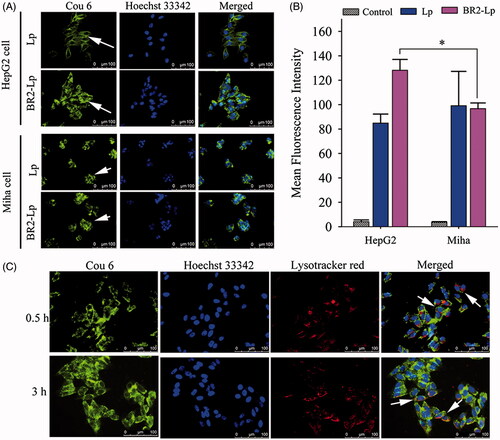
Figure 4. Confocal microscope images with an 8 μm interval between consecutive slides of HepG2 tumor spheroids after incubation with plain liposome and BR2-modified liposome with 0.5 μg/ml cou 6 concentration encapsulated for 20 h. The scale bar represents 100 μm.
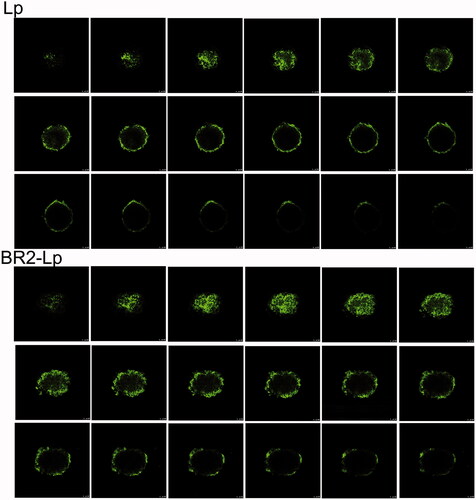
Figure 5. (A) Representative optical images of HepG2 tumor spheroids after exposure to a concentration of 10 μM CTD of different formulations. The scale bar represents 500 μm. (B) The mean gray levels of tumor spheroids in different groups were quantified by Image-J software with Fiji package. (C) Time-related volume of HepG2 tumor spheroids after treatment with different formulations at the same dose (10 μM CTD concentration) from 1 to 5 days. **p < .01. (D) HepG2 tumor spheroids preservation after 5-day treatment with different formulations. (E) Cell viability of the various formulations against HepG2 spheroids.
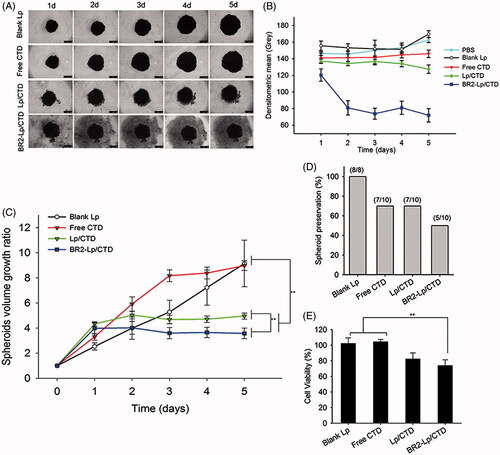
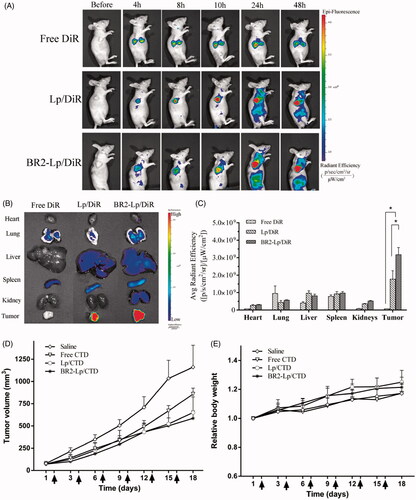
Figure 6. BR2 conjugation facilitates liposomes accumulation and enhances the anticancer efficacy in subcutaneous HepG2 xenograft tumor in nude mice. (A) In vivo fluorescence images of HepG2 tumor (150–200 mm3) bearing mice at different time points after single intravenous injection of different DiR formulations at dose of 2.0 mg/kg. At 4, 8, 10, 24 and 48 h after injection, mice with in vivo DiR fluorescence were imaged by IVIS Spectrum system. (B) After 48-h injection, the mice were sacrificed, and the tumors and vital organs were harvested and placed on a black paper for ex vivo imaging. (C) Average fluorescence signals of ex vivo tumors and organs after DiR treatment for 48 h *p < .05. (D) Anticancer effect on HepG2-tumor xenograft treated with BR2-Lp/DiR. Tumor volume changes after intravenous injection of saline, free CTD, Lp/CTD and BR2-Lp/CTD at a dose of CTD 0.35 mg/kg for a total of six injections with 3 days interval. (E) Body weight changes profile of tumor-bearing mice after treatment. Arrows indicate the drug administration time.