Figures & data
Figure 1. Principle of the synthesis of DSPE-PEG2000-T7/dA7R (A). MALDI-TOF mass spectra of DSPE-PEG2000-T7 (B) and DSPE-PEG2000-dA7R (C).
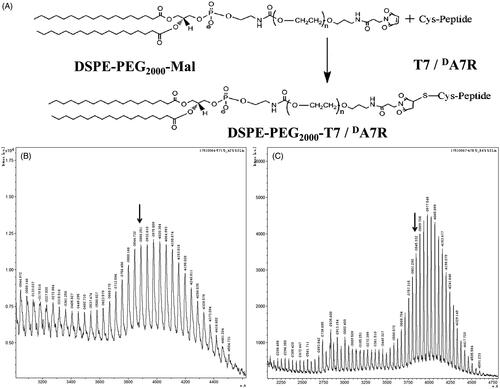
Figure 2. Physicochemical characterization of T7/dA7R-LS containing DOX and VCR. Morphological appearance of T7/dA7R-LS based on TEM (A) and AFM (B). Stability of T7/dA7R-LS in the presence of 10% FBS. The transmission and backscattering profiles were measured at each time point using a Turbiscan Lab® Expert analyzer (C).
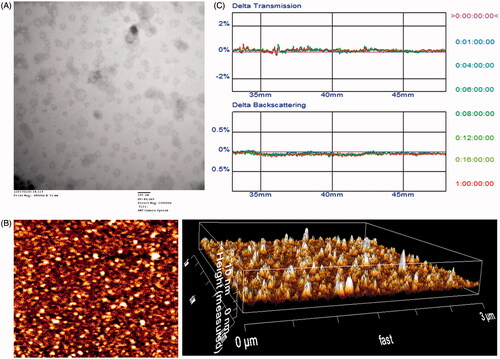
Table 1. Characteristics of the liposomes.
Figure 3. Cellular uptake of Cy5.5-loaded liposomes with different densities of T7 (A) and DA7R (B) in C6 cells after incubation for 2 h at 37 °C. The autofluorescence of the cells was applied as the control. Cellular uptake of different Cy5.5-loaded liposomes by bEND.3 cells (C), HUVECs (D), and C6 cells (E). The data are presented as the means ± SD (n = 3). *indicates p < .05.
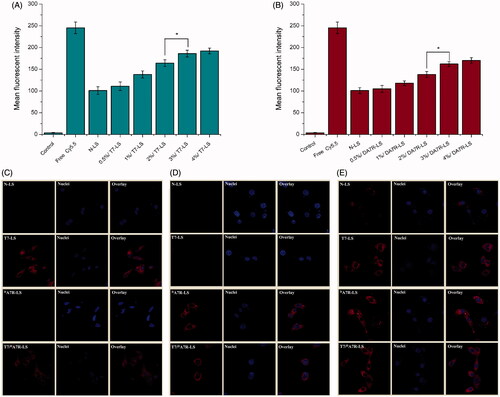
Figure 4. The cytotoxicity of free DOX + free VCR, and various liposomes containing DOX and VCR. The data are presented as the means ± SD (n = 3). *indicates p < .05.
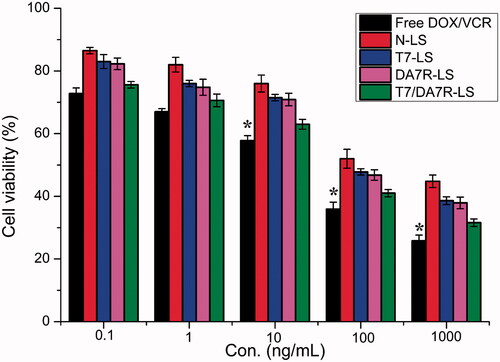
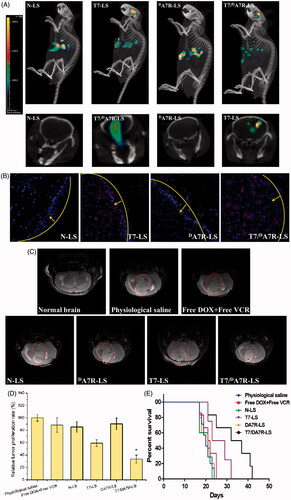
Figure 5. Biodistribution of Cy5.5 contained in various liposomes in mice bearing intracranial C6 glioma determined by an IVIS® Spectrum-CT (A). Distribution of Cy5.5 in the brain of mice bearing intracranial C6 glioma determined by a CLSM (B). MRI of normal and pathological brains at 16 d after inoculation (C). Relative tumor proliferation rate of the brain glioma (D). Kaplan–Meier survival curves (E). The yellow line shows the margin of intracranial glioma and arrow indicates the glioma cells. The red represents Cy5.5 and the nuclei were stained by DAPI (blue). The data are presented as the means ± SD (n = 6). *indicates p < .05. Notes: Efficacy after treatment with various formulations with a dose of 1 mg/kg (DOX 0.8 mg/kg + VCR 0.2 mg/kg) at days 8, 10, 12, and 14 from inoculation.