
Figures & data
Figure 1. Effect of carriers on the drug solubility: (A) SLS; (B) HPMC. The drug (1 g), various amounts (0.01–2 g) of SLS and/or various amounts (0.01–1 g) of HPMC were dissolved in 60 mL of 10% ethanol solution, respectively, and then spray-dried. Each value represents the mean ± SD (n = 3).
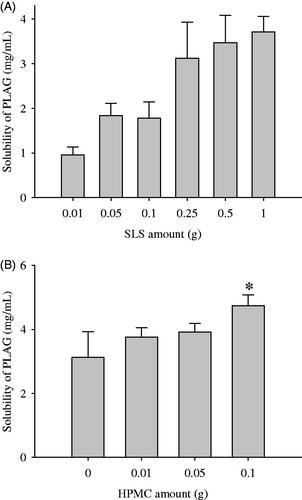
Figure 2. Effect of antioxidants on the stability of drug in 0.1% H2O2 solution at the accelerated conditions of 40 °C for 4 d. Each value represents the mean ± SD (n = 3).
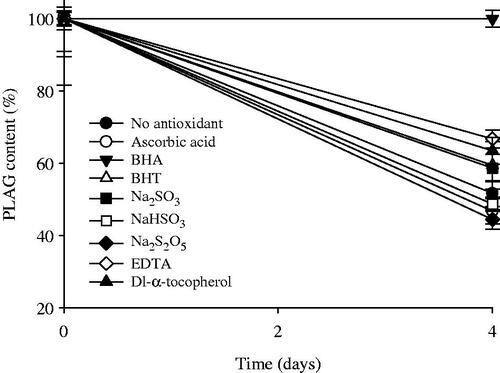
Figure 3. Scanning electron micrographs (A) and PXRD patterns (B): (a) calcium silicate; (b) SLS; (c) HPMC; (d) S-SNEDDS.
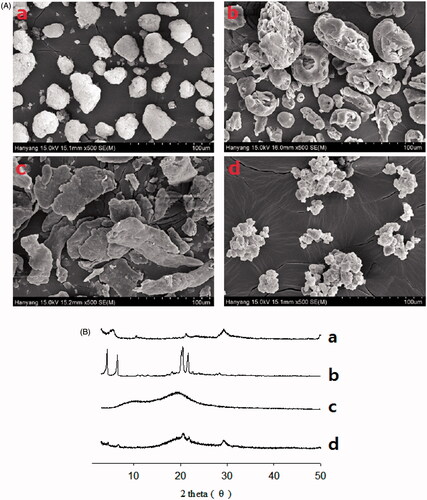
Figure 4. Dissolution profile of PLAG in distilled water (A), pH 6.8 buffer solution containing 2.5% SLS (B) and stability at 60 °C for 5 d (C) from S-SNEDDS, commercial soft capsule and drug. Each value represents the mean ± SD (n = 6).
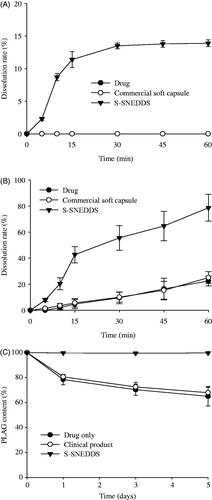
Figure 5. Mean plasma level–time profiles of PLAG after oral administration of S-SNEDDS, commercial soft capsule and drug at a dose equivalent to 200 mg/kg drug in rats. Each value designates the mean ± SD. (n = 8). The S-SNEDDS was composed of PLAG/SLS/HPMC/BHA/calcium silicate at a weight ratio of 1: 0.25: 0.1: 0.0002: 0.5. *p < .05 compared with drug only and commercial soft capsule.
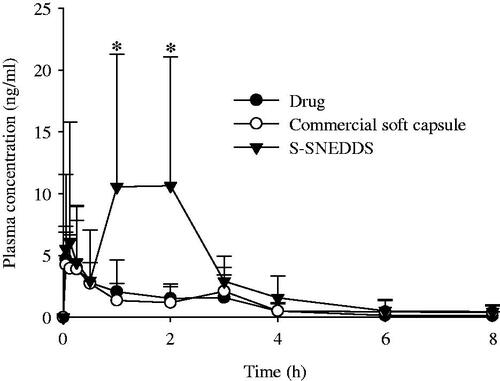
Table 1. Pharmacokinetic parameters.