Figures & data
Figure 1. Arterial angiogram of a rabbit liver (A) before embolization and (B) immediately after embolization with CBDOX and PVA. The hepatic artery trunk was occluded with CBDOX and PVA after embolization.
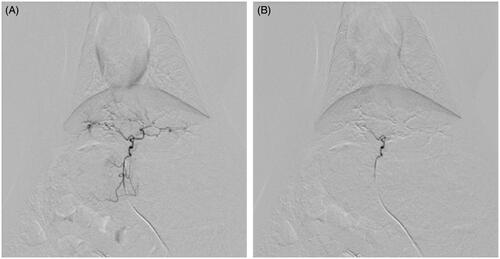
Figure 2. The plasma concentration curves of doxorubicin after liver artery embolization in two groups (n = 5). Symbols: (filled triangle) cTACE group; (filled circle) CBDOX group.
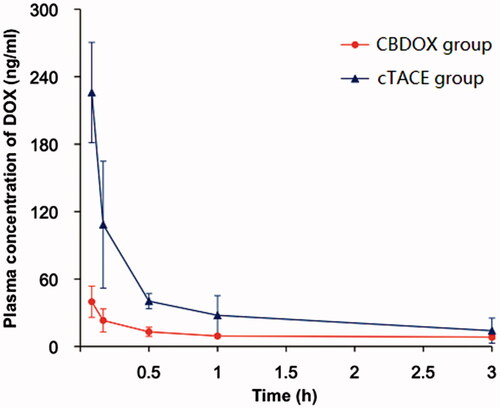
Table 1. Pharmacokinetic parameters based on noncompartmental pharmacokinetic analyses for embolization with CBDOX or cTACE of doxorubicin solution to rabbit livers (n = 5).
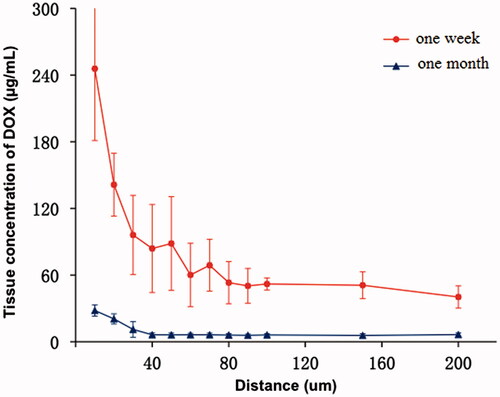
Figure 3. The tissue concentration curves of doxorubicin after liver artery embolization with CBDOX to rabbits (n = 5). Symbols: (filled triangle) 1 month group; (filled circle) 1 week group.