Figures & data
Figure 1. Preparation and characterization of TC-PEG-PLGA. (A) Synthesis route of TC-PEG-PLGA. (B) 1H NMR spectra. (C) Negative-stain transmission electron microscopy of TC-PEG-PLGA/ATO and PEG-PLGA/ATO micelles. (D) Encapsulation efficiency and drug loading of ATO-loaded micelles.
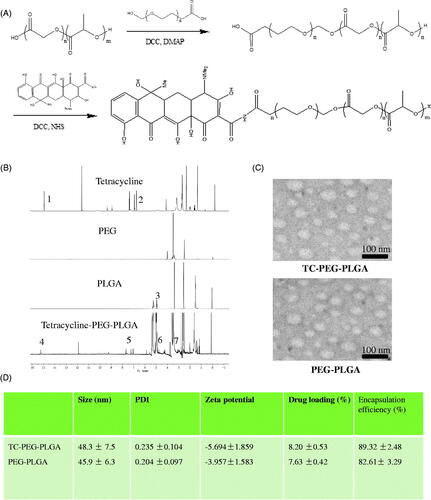
Figure 2. In vitro stability of TC-PEG-PLGA/ATO micelles at 4 °C or 37 °C. (A) Size and (B) PDI (mean ± SD, n = 3). (C) In vitro release profiles of free ATO, TC-PEG-PLGA/ATO and PEG-PLGA/ATO micelles at 37 °C in pH 7.4 PBS (mean ± SD, n = 3). (D) In vitro release profiles of TC-PEG-PLGA/ATO micelles at 37 °C in pH 7.4 PBS and pH 7.4 PBS containing 10% fetal bovine serum (mean ± SD, n = 3).
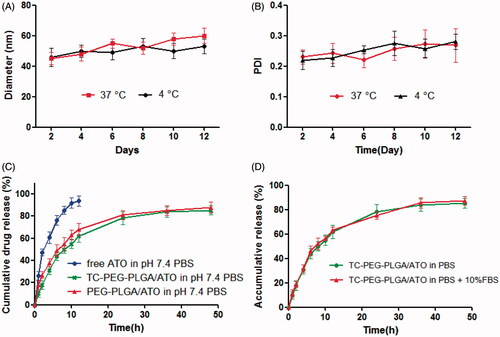
Figure 3. In vitro study of TC-PEG-PLGA micelles. (A) Viability of MC3T3-E1 cells after exposure to PEG-PLGA micelles or TC-PEG-PLGA (mean ± SD, n = 3). (B) Fluorescence images of MC3T3-E1 cells were incubated with DiD-loaded PEG-PLGA and TC-PEG-PLGA micelles for 2 and 4 h, respectively (scale bar =25 mm). (C) Quantitative results of cellular uptake measured by flow cytometry. *p > 0.05.
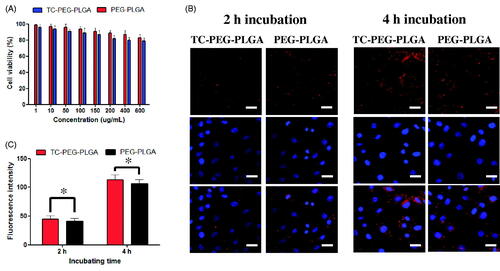
Figure 4. In vitro targeted efficacy and pharmacodynamic results. (A) and (B) Schematic diagram of HAp adsorption affinity experiment using FITC as a drug model and their results (mean ± SD, n = 5). (C) Effects of TC-PEG-PLGA/ATO micelles on mineralization of extracellular matrix by MC3T3-E1 cell culture (mean ± SD, n = 5). *p < 0.05, **p > 0.05.
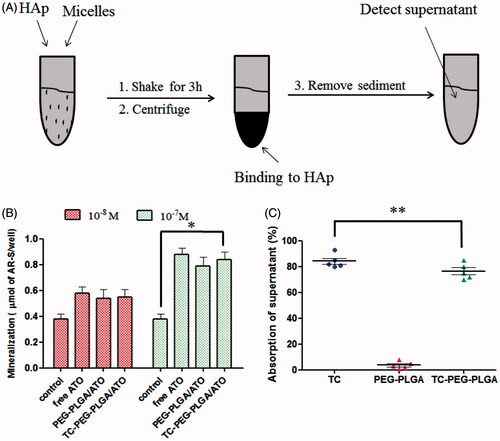
Figure 5. Biodistribution and pharmacokinetic study. (A) Images of dissected tissues at 24 h, including heart, liver, spleen, lung, kidney and bone. (B) and (C) Pharmacokinetics of free ATO, PEG-PLGA/ATO or TC-PEG-PLGA/ATO micelles in rats (mean ± SD, n = 5). T1/2: half-life; AUC: area under the concentration-time curve; MRT: mean residence time; CL: clearance rate; Vd: apparent volume of distribution.
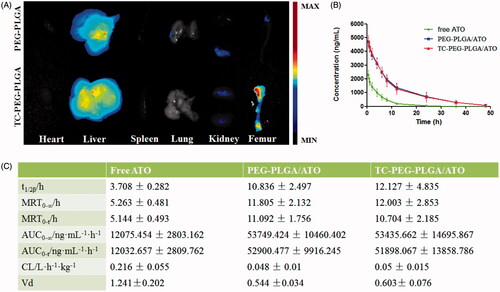
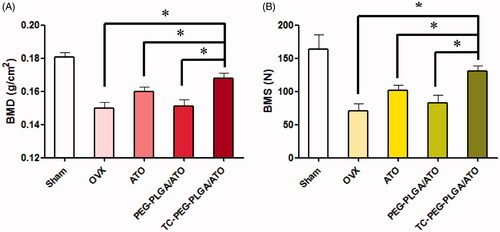
Figure 6. Anti-osteoporosis of TC-PEG-PLGA/ATO micelles. (A) Bone mineral density (BMD) of the femur in osteoporotic rats after 12 weeks treatment (mean ± SD, n = 5). (B) Bone mechanical strength (BMS) of femur in osteoporotic rats after 12 weeks treatment (mean ± SD, n = 5). *p < 0.05.