Figures & data
Figure 1. Stability of the NPs/OVA. Zeta potential of the NPs/OVA (A). Particle size and polydispersity index (PDI) of the NPs/OVA (B). Data are shown as mean ± SEM.
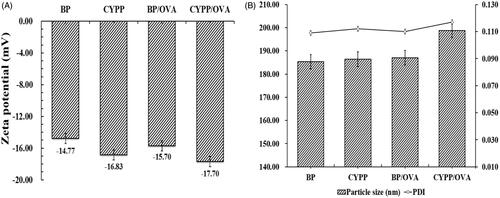
Figure 2. CLSM and TEM images of NPs and the cellular uptake of NPs. A total of 200 μL of FITC-OVA-stained NPs or CYP was incubated with 4 × 10⁵ DCs for 12 h. Confocal micrographs of DCs, in which different formulations were labeled using FITC-OVA (green color) and the nuclei (blue color), are stained using DAPI. The merged image shows the endocytosis of the freshly made formulations by the DCs. (A) CYP was labeled using FITC-OVA and co-cultured with DCs, (B) BPs were labeled using FITC-OVA and co-cultured with DCs, (C) CYPPs were labeled using FITC-OVA and co-cultured with DCs. Scale bar represents 5 μm. TEM micrographs of the CYPPs internalized by DCs and the arrow indicates the CYPPs (D). Scale bar represents 2 μm and 1 μm.
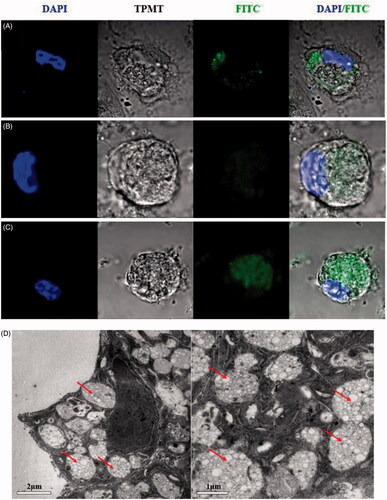
Figure 3. Investigation of the dendritic cell (DC) uptake of the different formulations, as assessed using flow cytometry. The percentage of MHC II+, CD80+, or CD86+ in CD11c+ DCs that had internalized the formulations. The results are representative of three separate experiments. *p < .05 vs. the BP group, while #p < .05 vs. the CYP group.
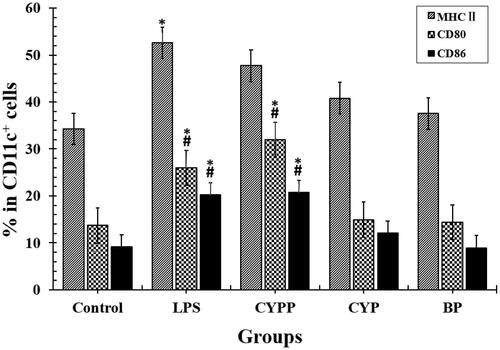
Figure 4. OVA-specific IgG antibody responses in mice immunized using different vaccine formulations. Data are expressed as the mean ± SEM. *p < .05 and **p < .01 vs. the BP/OVA group, while #p < .05 and ##p < .01 vs. the CYP/OVA group.
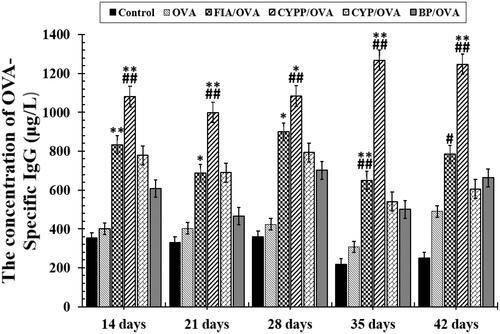
Figure 5. Mouse serum total IgG (A) and the ratios of IgG2a to IgG1 (B). Data are shown as the mean ± SEM. **p < .01 vs. the BP/OVA group, while ##p < .01 vs. the CYP/OVA group.
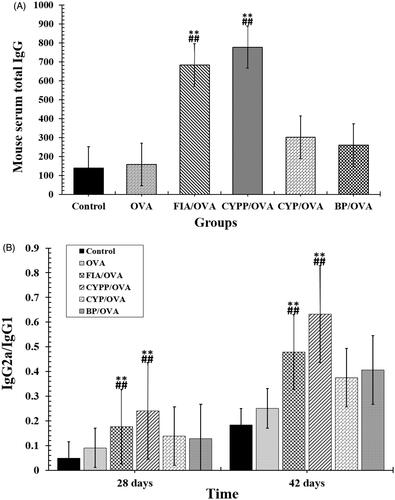
Figure 6. (A) Proliferation index and (B) the ratio of CD3+CD4+ cells to CD3+CD8+ cells in splenocytes harvested from vaccinated mice and re-stimulated using OVA. Data are expressed as the mean ± SEM. **p < .01 vs. the BP/OVA group, while ##p < .01 vs. the CYP/OVA group.
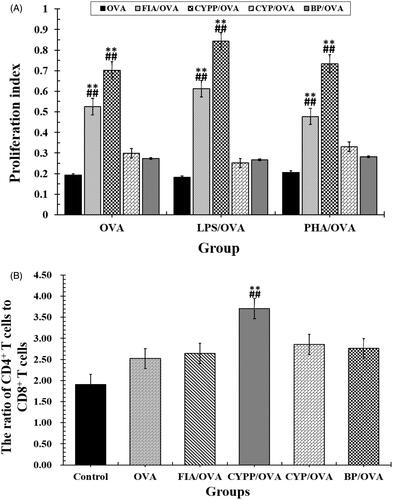
Figure 7. Cytokine secretion. Mice (n = 4) were immunized using different vaccine formulations. Splenocytes were harvested 21 d after the first immunization. For the ELISA assay, the splenocytes were re-stimulated using OVA (50 μg/mL) in vitro. The levels of IFN-γ and IL-2 (A), and IL-4 and IL-6 (B). Data are expressed as the mean ± SEM. *p < .05 and **p < .01 vs. the BP/OVA group, while #p < .05 and ##p < .01 vs. the CYP/OVA group.
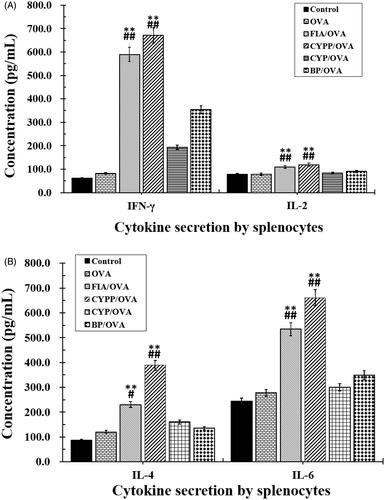
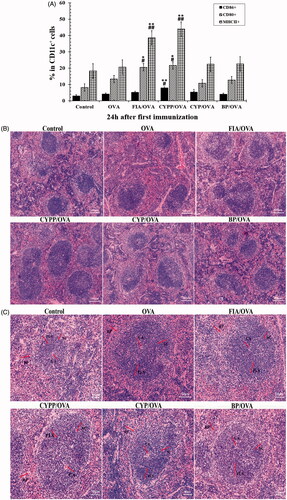
Figure 8. CYPP activating DCs in draining lymph nodes in vivo. The percentage of CD80+, CD86+, or MHC II+ cells (all CD11c+) from mice vaccinated using CYP/OVA, BP/OVA, GLP/OVA, or OVA alone, 24 h after the subcutaneous injection. Data are expressed as the mean ± SEM. *p < .05 and **p < .01 vs. the BP/OVA group, while #p < .05 vs. the CYP/OVA group (A). Hematoxylin–eosin staining of spleens of mice immunized using normal saline (control group), OVA alone, FIA/OVA, CYPP/OVA, BP/OVA, or CYP/OVA. CA: central artery; PLS: periarterial lymphatic sheath; SC: splenic corpuscle; RP: red pulp. Scale bar represents 100 μm (B) and 50 μm (C).