Figures & data
Scheme 1. Experimental animal groups.
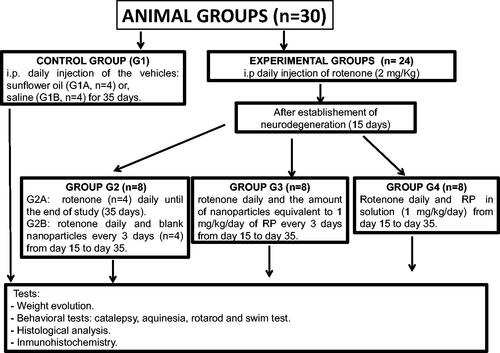
Table 1. Formulations prepared.
Figure 1. X-ray scattered intensity as a function of the diffraction angle 2θ. Intensity scaling is arbitrarily applied to the curves. Curves obtained for polymer (PLGA 502), blank nanoparticles (NP-B), RP-loaded nanoparticles (NPRP-3) and ropinirole (RP).
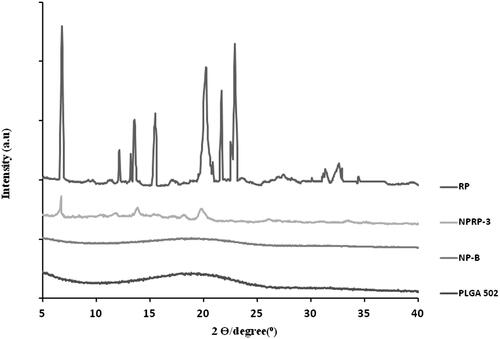
Figure 2. SEM microphotographs of RP-loaded PLGA nanoparticles (a). Particle size distribution (DLS image) (b). Mean release profiles (± S.E.M., n=3) of RP from PLGA nanoparticles (c). RP (ropinirole).
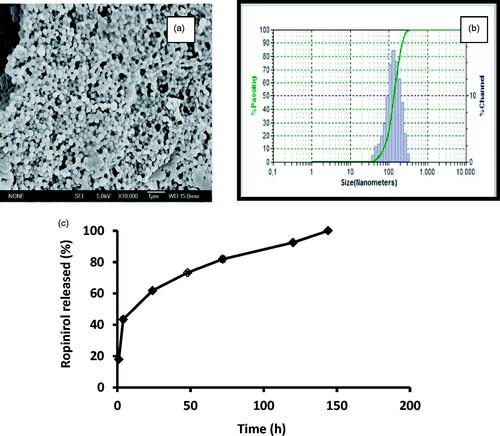
Figure 3. Evolution of rat-body weight throughout the study (36 d) (a). Results of the behavioral tests: catalepsy test on bar (b) and grid (c), akinesia test (d), rotarod (e) and swim-test (f) performed in all animal groups. G1: control group; G2: RT-treated control group; G3 and G4 RT-treated animals also receiving; G3: RP-loaded PLGA nanoparticles; and G4: RP in saline. RT (rotenone); RP (ropinirole).
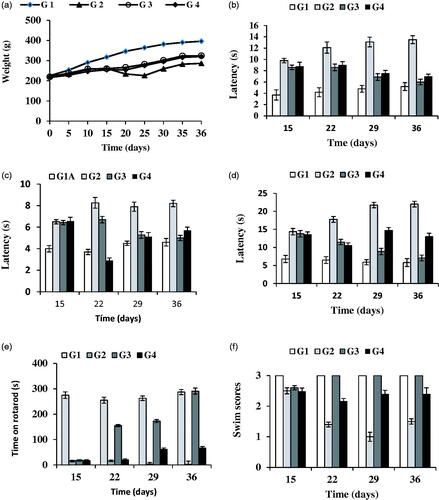
Figure 4. Representative Nissl-staining (cresyl violet) of nigral neurons from brain sections (substantia nigra pars compacta, 30 µm) corresponding to all animal groups. G1: control group; G2: RT-treated control group; G3 and G4 RT-treated animals also receiving; G3: RP-loaded PLGA nanoparticles and G4: RP in saline; RT: rotenone; RP: ropinirole.
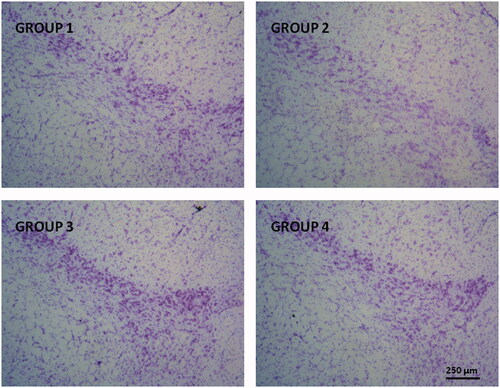
Figure 5. Glial activation induced by RT at the level of substantia nigra was prevented by RP as assessed by GFAP immunohistochemistry. Representative fluorescence micrographs of coronal brain slices at the level of the substantia nigra from all animal groups assayed (G1–G4). Arrow heads point to aberrant cell structures. G1: control group; G2: RT-treated control group; G3: RP-loaded PLGA nanoparticles and G4: RP in saline. RT: rotenone; RP: ropinirole.
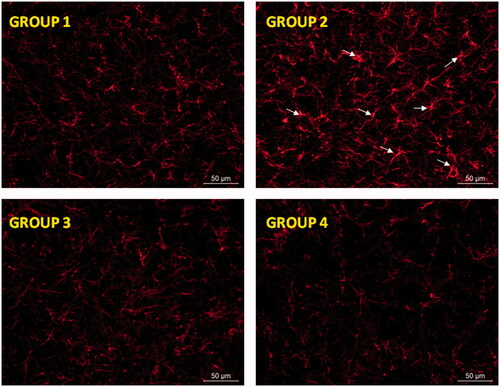
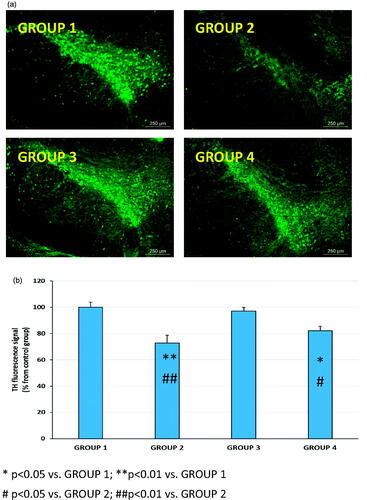
Figure 6. Representative TH immunohistochemistry fluorescence (a) and TH fluorescence signal (b) in coronal brain slices at the level of the substantia nigra for all animal groups (G1 to G4). G1: control group; G2: RT-treated control group; G3: RP-loaded PLGA nanoparticles; and G4: RP in saline. RT (rotenone); RP (ropinirole).