Figures & data
Table 1. TGDrad in cervical cancer after diverse treatment groups plus different irradiation dose.
Figure 1. Dose–response curves based on TGD and TGDrad. (A) Dose–response curves based on TGD; (B) Dose–response curves based on TGDrad; TGDrad, TGDrad = (TGD per treatment group plus irradiation) – (TGD per treatment group without irradiation); PTX: paclitaxel; DDP: cisplatin; PDMP: mixing mPEG-PCL/PTX micelles with DDP-loaded PECE hydrogels; IP: intraperitoneal injection; IT: intratumoral injection.
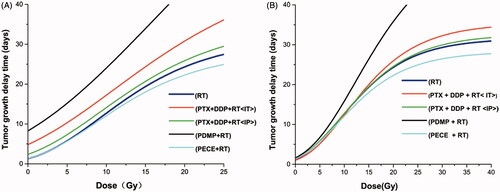
Figure 2. Treatment with PDMP + RT inhibited tumor growth in a subcutaneous HeLa model. (A) Suppression of tumor growth after PDMP + RT treatment in mice; (B) mouse survival curves per group; PTX: paclitaxel; DDP: cisplatin; PDMP: mixing mPEG-PCL/PTX micelles with DDP-loaded PECE hydrogels; IP: intraperitoneal injection; IT: intratumoral injection.
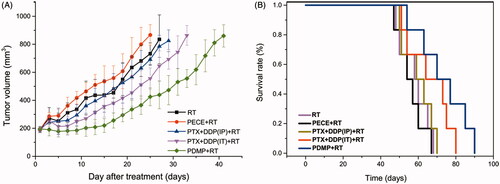
Table 2. Tumor growth delay (in days) in cervical cancer after diverse treatment groups plus 12 Gy irradiation.
Figure 3. Immunohistochemical analysis of γ-H2AX, CD133, and CD31 in a mouse xenograft model. PTX: paclitaxel; DDP: cisplatin; PDMP: mixing mPEG-PCL/PTX micelles with DDP-loaded PECE hydrogels; IP: intraperitoneal injection; IT: intratumoral injection.
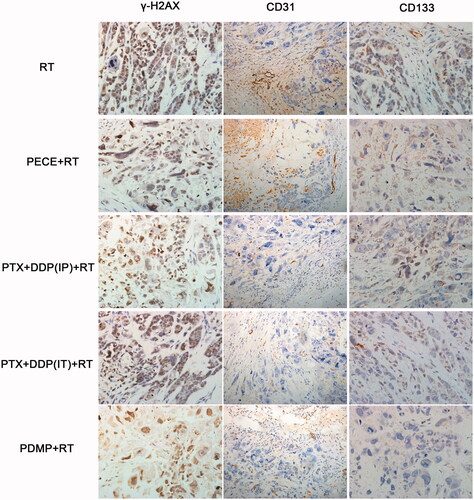
Figure 4. Quantitative analysis of γ-H2AX, CD133, and CD31 and the expression of ATM in xenografts from mice in various treatment groups. (A) quantitative analysis of γ-H2AX in mouse xenografts in various treatment groups; (B) quantitative analysis of CD133 in mouse xenografts in various treatment groups; (C) quantitative analysis of CD31 in mouse xenografts in various treatment groups; (D) expression levels of ATM in mouse xenografts in treatment various groups; PTX: paclitaxel; DDP: cisplatin; PDMP: mixing mPEG-PCL/PTX micelles with DDP-loaded PECE hydrogels; IP: intraperitoneal injection; IT: intratumoral injection.
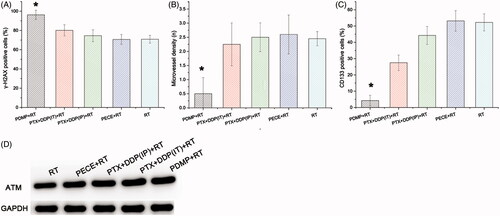
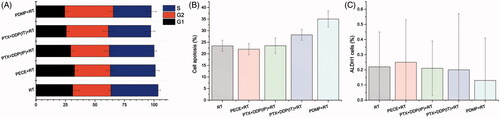
Figure 5. Flow cytometry analysis of tumor tissue from mice that received different treatments. (A) quantitative analysis of the percentage of cells in G1, S, G2/M phase in mouse xenografts in various treatment groups; (B) quantitative analysis of the percentage of apoptosis in mouse xenografts in various treatment groups; (C) quantitative analysis of the percentage of ALPH1 in xenografts from mice in various groups; PTX: paclitaxel; DDP: cisplatin; PDMP: mixing mPEG-PCL/PTX micelles with DDP-loaded PECE hydrogels; IP: intraperitoneal injection; IT: intratumoral injection.