
Figures & data
Table 1. The composition of ME formulations based on the D-optimal mixture design and the measured characteristics.
Figure 1. Screening of oils (A), surfactants (B) and cosurfactants (C), in addition to selection of the optimum Smix ratio (D).
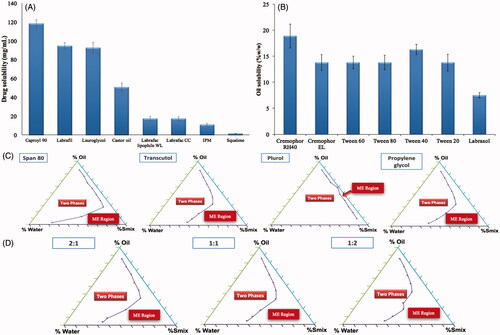
Figure 2. Contour diagrams for the effect of formulation variables on the globule size (A), optical clarity (B), Q1 (C), Q24 (D), ER (E) and desirability (F).
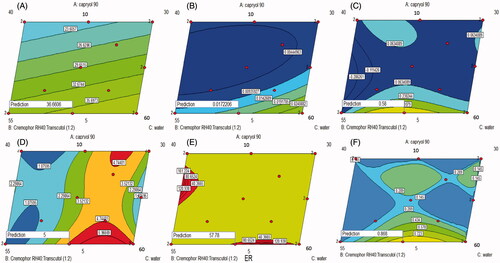
Figure 3. Rheological (A) and morphological (B) characteristics of the optimized ME gel formula.
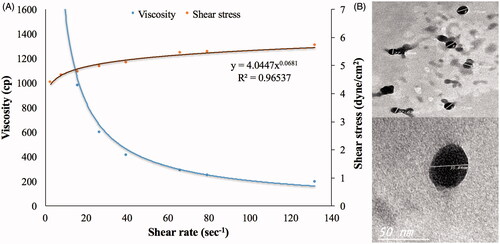
Figure 4. Ex vivo (A) and in vivo (B) permeation profiles of optimized ME gel in comparison with the drug hydrogel and the oral drug solution.
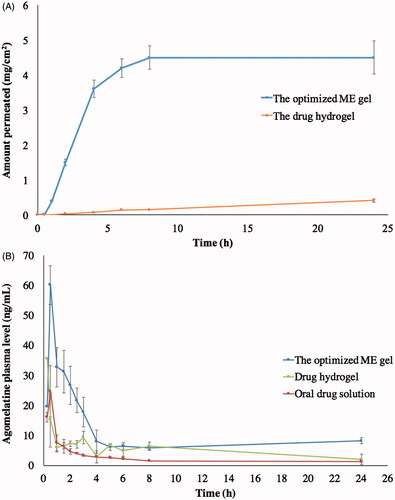
Table 2. Pharmacokinetic parameters of the optimized ME gel formula in comparison with the drug hydrogel and oral solution (A) and SAS analysis of Cmax, AUC0–24 h and AUC0–∞ (B).