Figures & data
Figure 1. TEM of PSSV-NPs (A) and MPSSV-NPs (B).
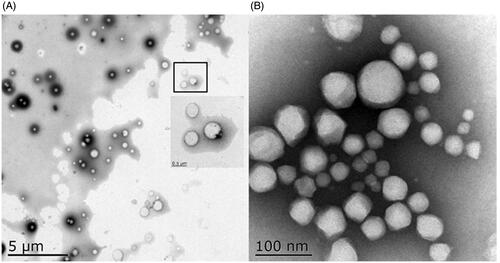
Figure 2. In vitro release studies. The GSH-sensitive release of PPM (A) and degradation of PPM-S-S-VE conjugate (C) from MPSSV-NP were studied at 37 °C under four different conditions, i.e. 10 mM, 1 mM, 10 μM, and 1 μM GSH, respectively (n = 3); in vitro cytotoxicity of PSSV-NPs and MPSSV-NPs with various concentration on MCF-7 (B) and HepG2 (D) cells after 72 h of incubation. (error bars are mean ± SD, n = 3).
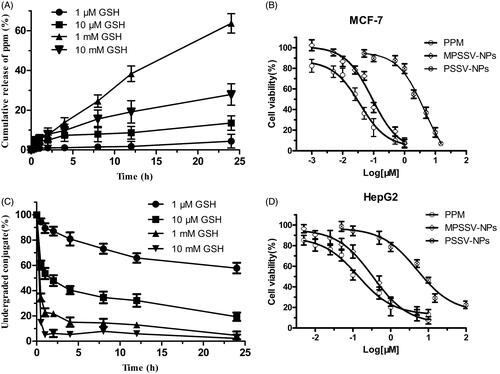
Figure 3. Tissue distribution of PPM after intravenous administration of PSSV-NPs and MPSSV-NPs injection in H22-bearing mice in blood, tumor, liver, spleen, lung, kidney, and heart (*p < .05, **p < .01, and n − 5 for each time point).
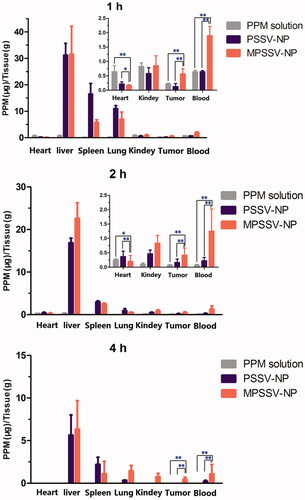
Figure 4. Graph showing tumor volume of H22 tumor-bearing mice in different treatment groups. (A) Antitumor effect in terms of tumor growth; (B) the change of body weight during the treatments; (C) tumor growth after systemic application of different treatment groups; (D) tumor weight (**p < .01, and n − 8 for each time point).
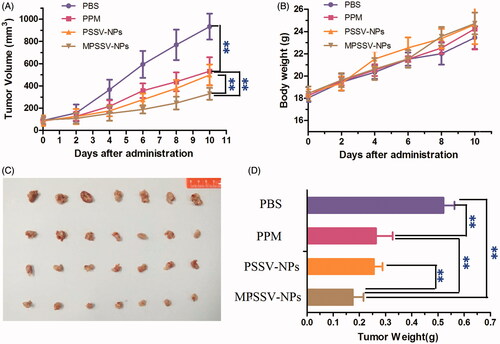
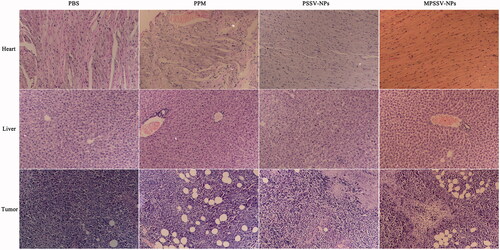
Figure 5. Typical histopathologic images of rat hearts, livers, and tumors after treatment in H22-bearing mice with PSSV-NPs and MPSSV-NPs group for 10 days (H&E staining, ×20).