
Figures & data
Figure 1. Optimization for the preparation of microemulsion composed of coix oil, mixed surfactant (RH40 + G-Rh2) and PEG400 at (A) different Km values and (B) various weight ratios of RH40 to G-Rh2 through plotting the pseudoternary phase diagrams. The red region (M) and the gray region (G) represent the microemulsion and gel formulation under the corresponding preparation condition, respectively.
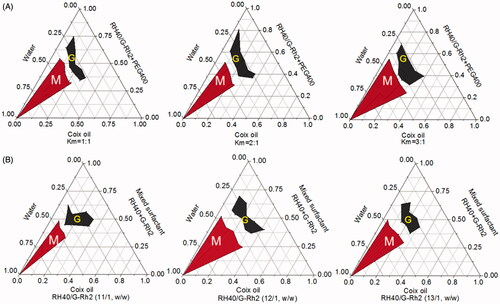
Figure 2. Characterizations of microemulsions. (A) The particle size and zeta potential of ECG-MEs with the different amounts of G-Rh2. All the data are presented as mean ± SD (n = 3). (B) The drug encapsulated efficiency (EE) of ECG-MEs with different amounts of G-Rh2. All the data are presented as mean ± SD (n = 3). The changes of size and zeta potential of ECG-MEs under (C) different pH values and (D) within 7 d. All the data are presented as mean ± SD (n = 4). (E) TEM images of various types of microemulsions. The scale bar is 50 nm.
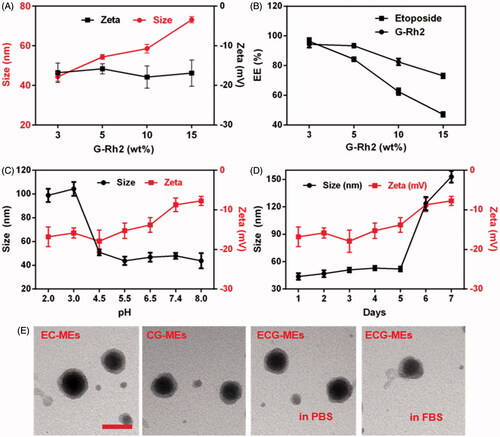
Figure 3. Cellular studies. (A) The fluorescence images of A549 cells treated with various formulations observed by the fluorescence-inverted microscope. The scale bar is 50 μm. (B) Quantitation of intracellular green fluorescence intensity measured using the flow cytometry. **p < .01 versus FITC; ##p < .01 versus FITC/EC-MEs. All the data are presented as mean ± SD (n = 3). (C,D) Mechanism of cellular uptake. The relative uptake efficiency of (C) ECG-MEs and (D) EC-MEs after pretreating A549 cells with different endocytosis inhibitors. **p < .01 versus control. All the data are presented as mean ± SD (n = 4).
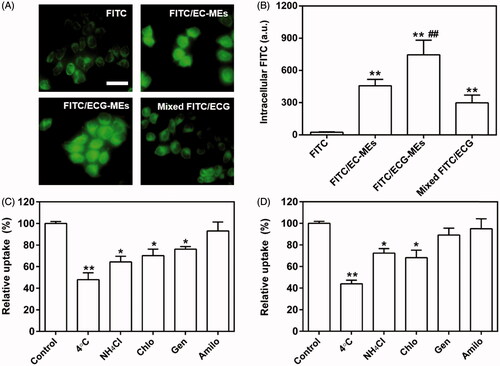
Figure 4. Evaluation on the penetration of microemulsion with (A) small size (40 nm) and (B) large size (120 nm) using A549 3D tumor spheres model. The CLSM images were used Z-stack imaging technology with 10 μm intervals from the surface to the core. The green represents the autofluorescence of GFP-transfected A549 cells and the red represents the penetrated DiI/MEs. The scale bar is 500 μm.
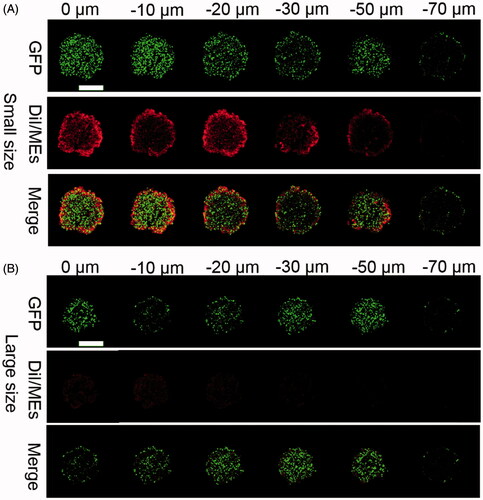
Figure 5. (A,B) Cytotoxicity of different treatments against A549 cells for 48 h. **p < .01, all the data are presented as mean ± SD (n = 6). (C,D) A549 cell apoptosis induced by different etoposide formulations. (C) In each quadrant of apoptosis, the upper right and lower right zones represent the late apoptosis and the early apoptosis, respectively. (D) The quantification of cell apoptosis rate after various treatments. **p < .01, all the data are presented as mean ± SD (n = 4).
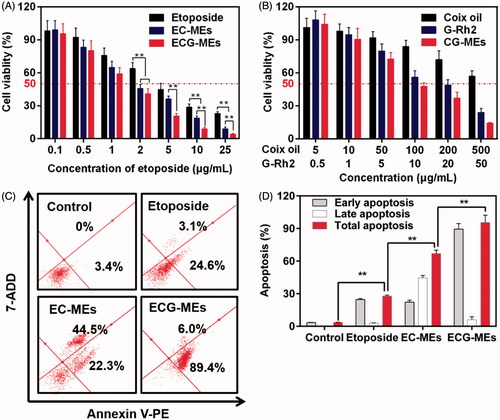
Table 1. The IC50 and combined index of various types of formulations against A549 cells (n = 6).
Figure 6. Evaluation on the in vivo antitumor efficacy. (A) The changes in the tumor growth of A549 tumor-bearing mice after various treatments for two weeks. The arrow represents the time of intragastric administration. **p < .01 versus ECG-MEs. All the data are presented as mean ± SD (n = 8). (B) The ratio of Vt to V0, V0, and Vt represent the volume of tumors at day 8 and day 24, respectively. **p < .01, all the data are presented as mean ± SD (n = 8). (C) The inhibition rate of tumor growth under different treatments. **p < .01, all the data are presented as mean ± SD (n = 8). (D) Kaplan–Meier survival curves of the A549 tumor-bearing mice within 90 d. (E) The tumor sections stained with FITC-dUTP using fluorescence inverted microscope. The green represents the DNA fragments of apoptotic cells. The blue represents the nuclei. The scale bar is 20 μm. (F) The images of different organ sections stained with HE after various treatments. The scale bar is 100 μm.
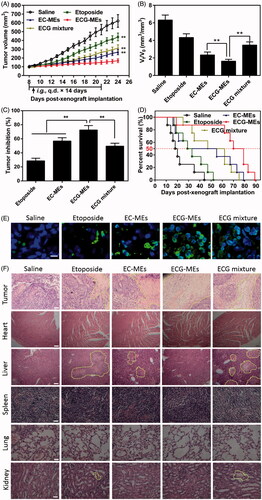
Figure 7. Evaluation on safety. (A) The changes in the body weight of mice during the treatment. All the data are presented as mean ± SD (n = 8). (B–H) Cytokine detections. The content of (B) IL-2, (C) IFN-γ, (D) CCl2, (E) TNF-α, (F) IL-10, (G) TGF-β1, and (H) IL-6 in the serum of mice after 72 h of the last administration. **p < .01, all the data are presented as mean ± SD (n = 8).
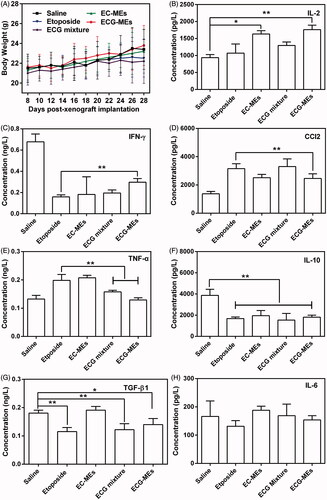
Table 2. The weight ratio of liver/spleen to the body and the serum concentration of liver enzymes and acute renal lesion indicator.