Figures & data
Figure 1. (a) Schematic fabrication of intelligent RGDfk–histidine–PLGA-NPs for pulmonary mitochondrial-targeted drug delivery. (b) TEM images of yuanhuacine/MNPs. (c) Acid titration profiles of blank solution, PLGA-NPs, and MNPs solutions.
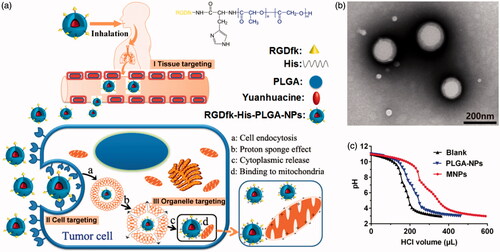
Figure 2. Biodistribution of intravenous or inhaled administration of yuanhuacine/MNPs accumulation in the (a) liver, (b) kidney, (c) spleen, (d) reproductive, and (e) lung at different time points with a yuanhuacine dose of 100 μg/kg (n = 4). *p < .05, **p < .01 versus intravenous group.
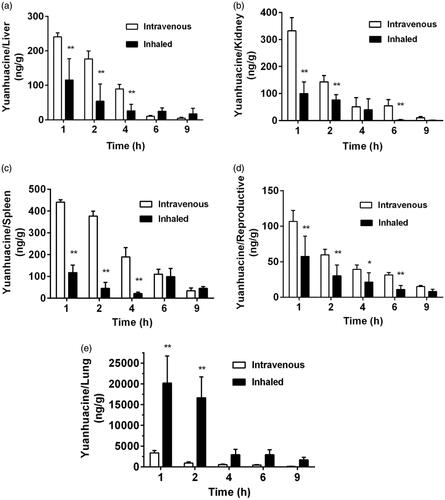
Table 1. Lung targeting efficiency (Te) of yuanhuancine/MNPs.
Figure 3. Cellular uptake on A549 cells after applying yuanhuacine, yuanhuacine/PLGA-NPs, and yuanhuacine/MNPs at (a) different time, (b) different drug concentration, (c) different temperature, and (d) relative uptake efficiency (%) in the presence of various endocytosis inhibitors. *p < .05, **p < .01 versus control.
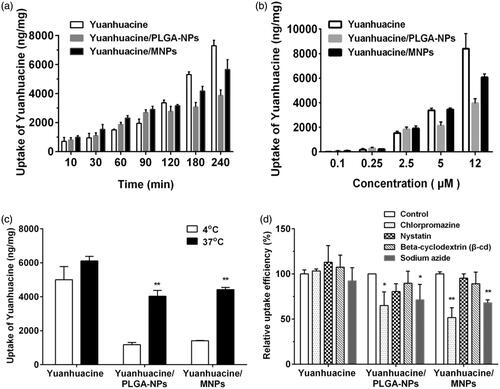
Figure 4. Images of intracellular delivery of C6 labeled PLGA-NPs and MNPs in A549 cells. Merged image of the NPs with the dyes was indicated by arrows.
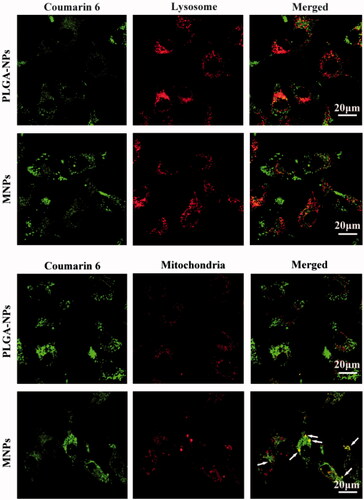
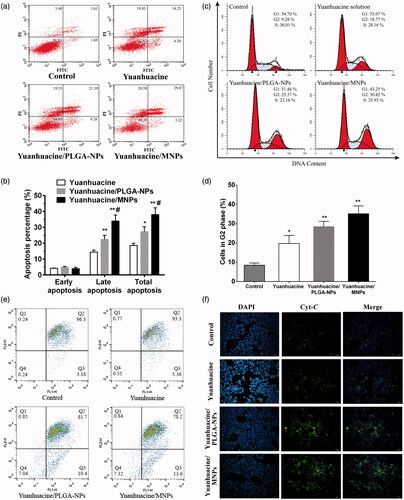
Figure 5. (a) Flow cytometric images to detect apoptosis and (b) apoptosis percentage on A549 cells after applying yuanhuacine, yuanhuacine/PLGA-NPs, and yuanhuacine/MNPs with yuanhuacine concentration of 10 μM for 24 h. *p < .05, **p < .01 versus yuanhuacine, #p < .05 versus yuanhuacine/PLGA-NPs. (c) Cell cycle and (d) cell percentage in G2 phase on A549 cells after applying yuanhuacine, yuanhuacine/PLGA-NPs, and yuanhuacine/MNPs with yuanhuacine concentration of 10 μM for 24 h. *p < .05, **p < .01 versus control. (e) Mitochondrial membrane potential measurement and (f) cytochrome c detection on A549 cells after applying yuanhuacine, yuanhuacine/PLGA-NPs and yuanhuacine/MNPs at a yuanhuacin concentration of 10 μM for 24 h.