Figures & data
Figure 1. Schematic diagram of RED system.
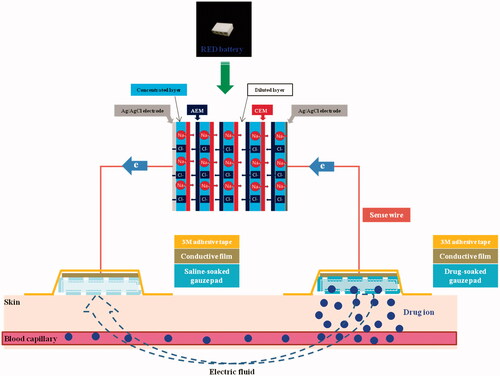
Table 1. Mass detector parameters used for the analysis of vitamin C, lopinavir, ketoprofen, and valsartan (IS).
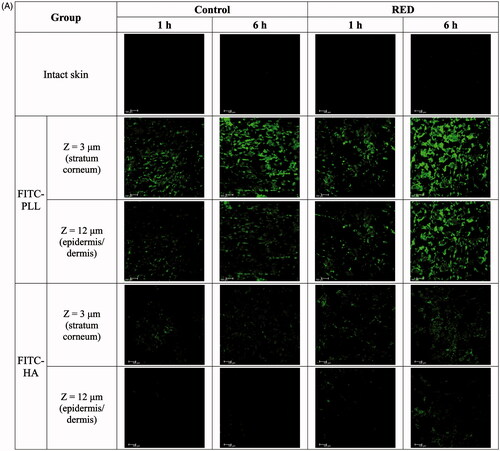
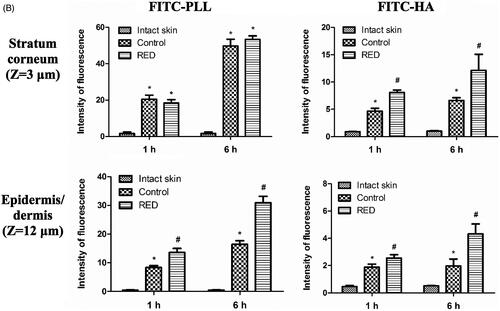
Figure 3. The amount of vitamin C deposited in the stratum corneum and epidermis/dermis of hairless mouse skin at 6 h after the application of vitamin C-soaked gauze dressing without the RED system (control) and vitamin C-loaded RED system (RED) on the mouse skin fixed in the diffusion cells. The rectangular bars and their error bars represent the means and standard deviations (n = 3–4). The asterisk (*) represents a value significantly different from that of the stratum corneum, and the pound sign (#) represents a value significantly different from that of the control group (p < .05).
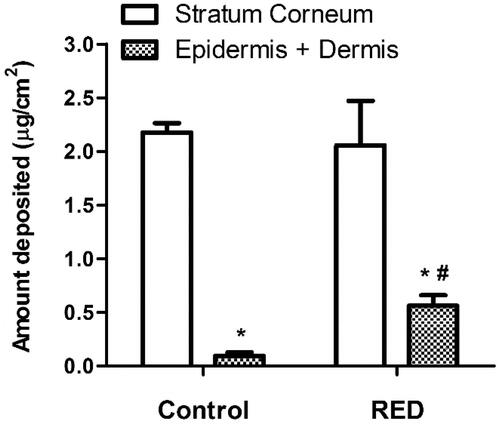
Figure 4. In vitro hairless mouse skin permeation profiles of lopinavir after the application of lopinavir-soaked gauze dressing without the RED system (control) and lopinavir-loaded RED system (RED) on the mouse skin fixed in the diffusion cells (A) and the arterial plasma concentration versus time profiles of lopinavir after the transdermal application of lopinavir-soaked gauze dressing without the RED system (control) and lopinavir-loaded RED system (RED) in rats (B). Bullet symbols and their error bars represent the means and standard deviations (n = 3–4). The asterisk (*) represents a value of the RED group significantly different from that of the control group (p < .05).
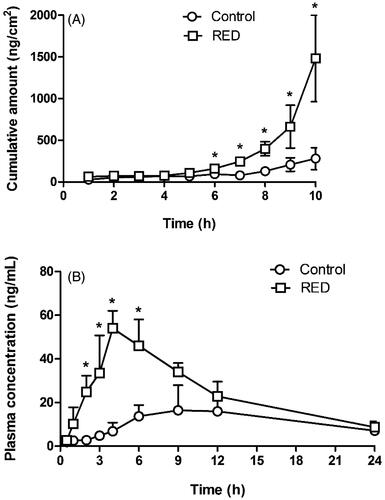
Table 2. In vitro skin permeation parameters of lopinavir after the application of lopinavir-soaked gauze dressing without the RED system (control) and lopinavir-loaded RED system (RED) on the hairless mouse skin fixed in the diffusion cells (n = 3–4).
Table 3. Pharmacokinetic parameters of lopinavir after the transdermal application of lopinavir-soaked gauze dressing without the RED system (control) and lopinavir-loaded RED system (RED) in rats (n = 3–4).
Figure 5. In vitro hairless mouse skin permeation profiles of ketoprofen after the application of ketoprofen-soaked gauze dressing without the RED system (control), ketoprofen-loaded RED system (RED), and Ketotop® patch without the RED system (Ketotop®) on the mouse skin fixed in the diffusion cells (A) and the arterial plasma concentration versus time profiles of ketoprofen after the transdermal application of ketoprofen-soaked gauze dressing without the RED system (control), ketoprofen-loaded RED system (RED), and Ketotop® patch without the RED system (Ketotop®) in rats (B). Bullet symbols and their error bars represent the means and standard deviations (n = 3–4). The asterisk (*) represents a value of the RED group significantly different from that of the control group (p < .05), and the pound sign (#) represents a value of the Ketotop® group significantly different from that of the control group (p < .05).
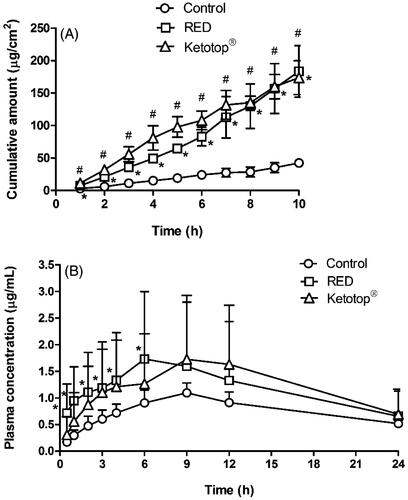
Table 4. In vitro skin permeation parameters of ketoprofen after the application of ketoprofen-soaked gauze dressing without the RED system (control), ketoprofen-loaded RED system (RED), and Ketotop® patch without the RED system (Ketotop®) on the hairless mouse skin fixed in the diffusion cells (n = 3–4).
Table 5. Pharmacokinetic parameters of ketoprofen after the transdermal application of ketoprofen-soaked gauze dressing without the RED system (control), ketoprofen-loaded RED system (RED), and Ketotop® patch without the RED system (Ketotop®) in rats (n = 3–4).
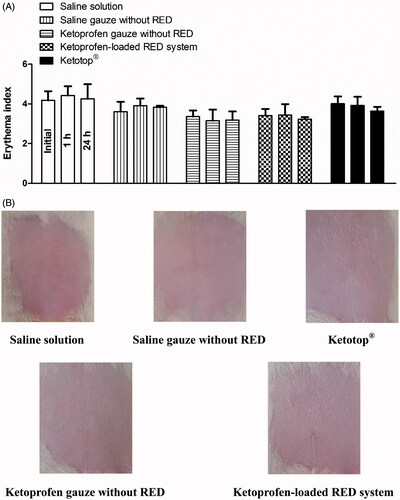
Figure 6. Erythema indices of skin at 0, 1, and 24 h (A) and its photographs at 24 h (B) after the transdermal application of saline solution, saline-soaked gauze dressing without the RED system (Saline gauze without RED), ketoprofen-soaked gauze dressing without the RED system (Ketoprofen gauze without RED), ketoprofen-loaded RED system, and Ketotop® patch without the RED system (Ketotop®) in rats. The rectangular bars and their error bars represent the means and standard deviations (n = 3–4).