Figures & data
Figure 1. Schematics of self-construction of aptamer-orientated DNA TDT for targeting transportation of chemotherapeutics in theranostic applications. (A) Self-construction of TDT from short DNA aptamer ZW25: (1) The initial ZW25. (2) The ZW25 chimeric that linked to a trigger ligand. (3) Initiation from the first hybridization probe P1. (4) The further construction with hybridization probe P2. (5) The resultant long strands. (6) Drug loading onto TDT. (B) The drugs were specifically transported to target cancer cells via receptor binding between CD123 and aptamer ZW25: (1) TDT was targeted binding to CD123+ cancer cells and internalized via the binding specificity of aptamer ZW25 to CD123 protein. (2) TDT was transferred by endocytic/lysosome vacuole. (3) endocytic/lysosome vacuole was burst and TDT was degraded by enzyme. (4) Dox was released within nuclei and induced cell death. (C) TDT could inhibit tumor growth and prolong survivals.
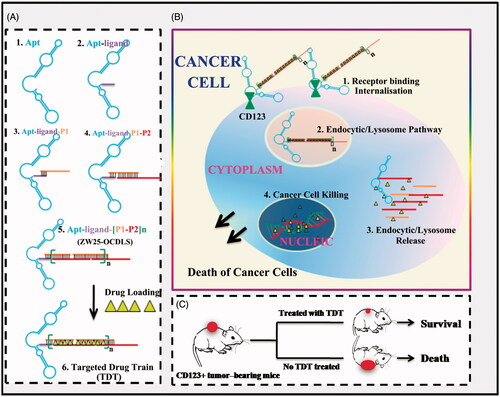
Figure 2. Schematic representation of SELEX system. A. Random DNA sequences contains 66-mer oligonucleotides with 28-base long randomized in central and fixed sequences at both sides. When folded into a three-dimensional structure, it became a high complexity ssDNA library that could satisfy SELEX completely. CD123 peptides were fixed on magnetic beads by NHS/EDC reaction. SELEX round contains binding, partition and enrichment. After several rounds, the pool was cloned. B. Flow cytometry monitoring of the enrichment of aptamers. Compared with the starting random DNA pool, flow cytometry revealed an increase in fluorescence intensity of aptamers bound to the CD123 peptide after the second, the fourth, the sixth and ninth rounds of selection. C. Flow cytometry monitoring of the nonspecific binding to BSA of aptamers.
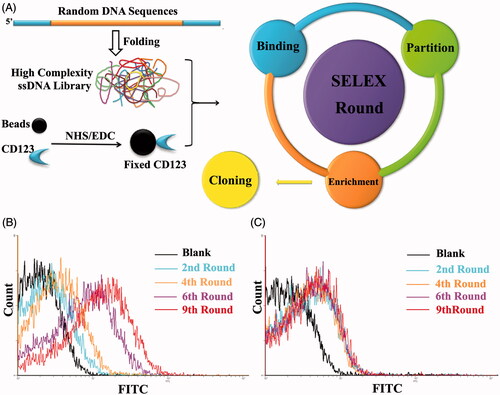
Figure 3. Characterization of aptamers ZW25 and CY30. (A,B). Flow cytometry evaluation of the binding specificity to CD123-peptide or other negative proteins by FITC-labeled aptamers ZW25 and CY30. FITC-labeled aptamers ZW25 (A) or CY30 (B) was incubated with CD123 peptide beads, BSA beads and trypsin beads separately. The black curves represent the control fluorescent signals generated by FITC-labeled random DNA from the library pool. (C,D). The predicted secondary structure of ZW25 and CY30. The secondary structures of aptamer ZW25 (C) and CY30 (D) was predicted by M-fold software. (E,F). Flow cytometry evaluation of the binding affinities to CD123-peptide by FITC-labeled aptamers ZW25 (E) and CY30 (F). (G–J). Flow cytometry to assess ZW25’s binding specificity to CD123 + and CD123− cells. The histograms were generated after incubating FAM-labeled ZW25 with TF-1 (G), Molm-13 (H), RCH-ACV (I) and EL4 (J) cells, respectively. The filled histograms represent the control fluorescence signals generated by FAM-labeled random DNA from the library pool. (K,L). Flow cytometry evaluation of ZW25’s binding affinity to CD123 + and CD123− cells treated by trypsin. CD123 + cell line Molm-13 (K) and CD123− cell line RCH-ACV (L) were treated with trypsin or PBS for 5 min and treated with FAM-labeled aptamer ZW25. Control fluorescent signal (gray filled) was generated by untreated Molm-13 or RCH-ACV cells incubated with FAM-labeled random DNA.
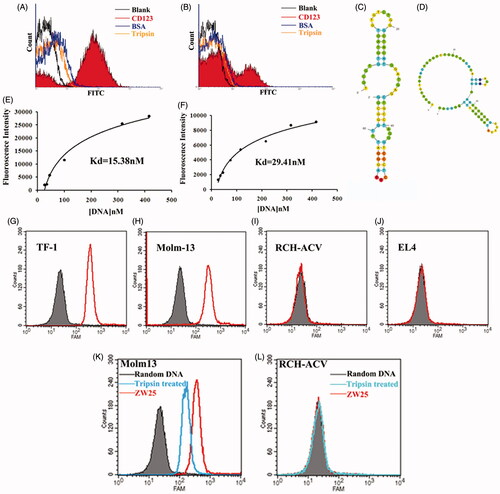
Figure 4. Characterization of the construction, selective cancer cell binding of TDT. (A,B). Analyzing secondary structure and thermodynamics of the P1 (A) and P2 (B) by M-fold software. C. Agarose gel electrophoresis indicating the self-assembly of ZW25-OCDLS derived from ZW25-ligand. (D,E). Flow cytometry results showing the selective recognition abilities of ZW25-OCDLS to Molm-13 cells (D), but not to RCH-ACV cells (E). F. Confocal microscopy images displaying the selective binding of ZW25-OCDLS to Molm-13 and RCH-ACV cells. Cells were incubated with ZW25-OCDLS (15,000 nM ZW25-ligand equivalents) at 37 °C for 4 h (P1 and P2: labeled with FAM). (Scale bars: ×20:100 μm; ×40: 50 μm.) G. Fluorescence spectra of doxorubicin solution (5 μM) with increasing molar ratios of the ZW25-OCDLS (from top to bottom: 0, 1:500, 1:400, 1:300, 1:250, 1:200, 1:150, 1:100, 1:80, 1:50, 1:30 and 1:10). The fluorescence quenching indicates Dox loading into ZW25-OCDLS. H. Dotted data points showing the fluorescence intensities of Dox diffused from free Dox or TDT (Dox: 50 μM) during dialysis to outside PBS buffer at different time points.
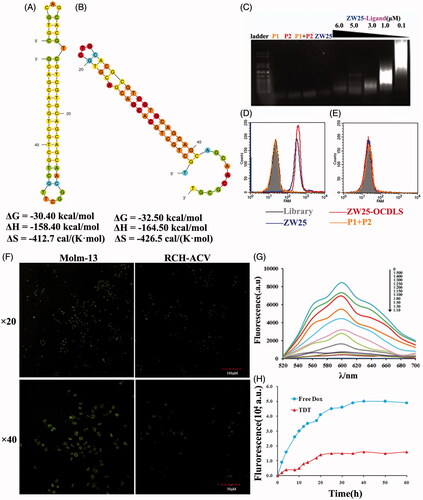
Figure 5. Dox’s selective delivery by TDT to CD123 + tumor cells (Molm-13) and monitoring of intracellular drug unloading via endocytosis/lysosome pathway. (A,B) Confocal laser scanning microscopy images of Molm-13 (A) and RCH-ACV cells (B) after incubation with free doxorubicin or TDT for 4 hours. (C–F) Confocal laser scanning microscopy images of TDT-mediated selective drug delivery to CD123 + tumor cells via endocytosis/lysosme. CD123 + Molm-13 cells (C and D) and CD123− RCH-ACV cells (E and F) were treated either with free Dox (C and E; 2 mM) or TDT (D and F; 2 mM Dox equivalents) for 2 h, followed by transferrin-Alexa 633 staining (arrows indicated probative cells; Scale bar: 30 μm).
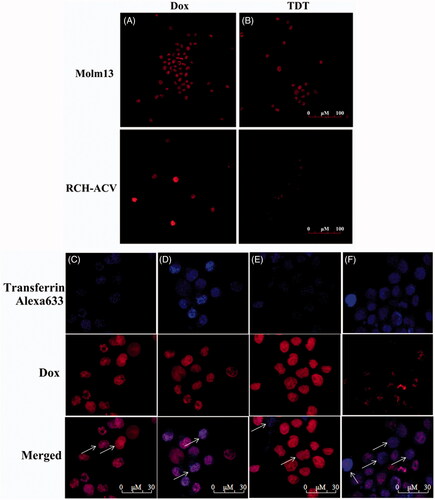
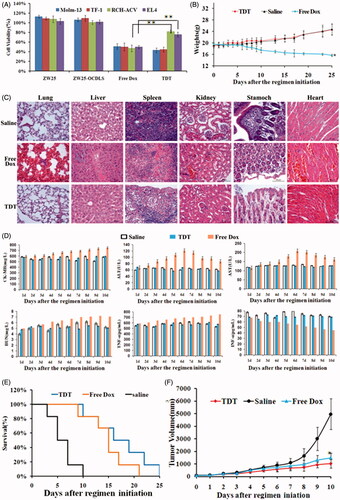
Figure 6. Potential reduced side effects and anticancer ability of TDT in vitro and in vivo. A. Cell viability assays in vitro after the cells were treated with CD123 aptamer ZW25, ZW25-OCDLS, free Dox or TDT for 3 h. The cell viability of Molm-13, TF-1, RCH-ACV and EL4 cells were evaluated by CCK8 assay after 48 h of further incubation (mean ± SD, n = 6, *p < .05). (B,C). TDT reduced cytotoxicity to normal tissues in vivo. Mice were randomly divided into two groups and treated either with TDT or saline. B. Weights up to 25 days after treatment initiation (mean ± SD; n = 6). C. 25 days after initial treatment, mice were euthanized and the heart, liver, kidney, spleen, stomach and lung tissues were observed by H&E staining. D. Serology assessment. A. Serum markers of organ damage. Each bar represents means with SD of six replicates. (E,F) TDT-targeted ability to inhibition CD123 + tumor growth. Molm-13 xenograft mouse tumor model was developed by s.c. injection of Molm-13 cells in the back of Babl/c mice. Mice were divided into three groups randomly, in which the following regimens with different agents were administered by i.v. injections each day: (i) TDT, (ii) free Dox (2 mg/kg), and (iii) saline (n = 6). E. Survival rate of mice after treatment initiation. F. Tumor volumes of mice after treatment initiation.