Figures & data
Figure 1. In vitro characterization of the AP/PTX-SLNs. (A) The average size and PDI of the SLNs, the AP-SLNs, the PTX-SLNs and the AP/PTX-SLNs. (B) The zeta potential of the four formulations. (C) TEM images of the four formulations. Scale bar: 200 nm. (D) Differential scanning calorimetry (DSC) thermograms of the AP/PTX-SLNs. (E) The encapsulation efficiency and stability of the AP-SLNs, the PTX-SLNs and the AP/PTX-SLNs at different time intervals. (F) Release profiles of AP and PTX from the formulations in PBS with 20% ethanol at pH 7.4 (a); the influence of pH (5.5 and 7.4) on the release of AP and PTX from the AP/PTX-SLNs (b).
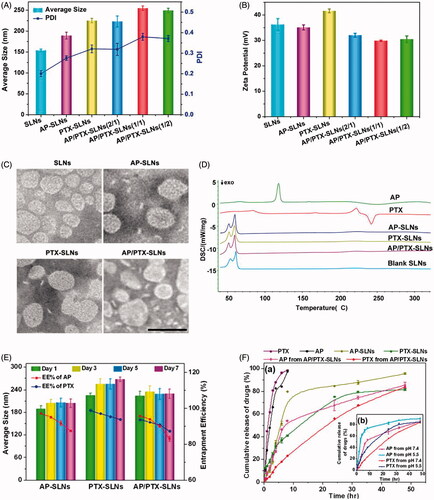
Figure 2. Cellular uptake of SLNs by the B16F10 cells illustrated by fluorescence images and flow cytometry histograms. Intracellular distribution of coumain-6-loaded SLNs for different coumain-6 concentrations (A) at different time points (B). The color green represents coumain-6-loaded SLNs absorbed by cells; blue is the color of cell nucleus stained with DAPI. Scale bar represents 40 μm. (C) The fluorescence intensity of the cells after incubation with free coumarin-6 and the SLNs at the indicated time points. (D) The fluorescence intensity of the cells after incubation with different concentrations of free coumarin-6 and the SLNs. The MFI of SLNs was larger than that of Coumarin-6 at corresponding time or concentration. The data are presented as the mean ± SD (n = 3).
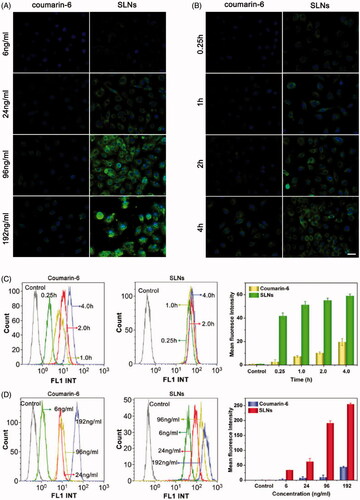
Figure 3. Antitumoral effects of the SLN formulations in the B16F10 cells in vitro. (A) Flow cytometric analysis of B16F10 cell apoptosis induced by the SLN formulations. (B) Cell apoptosis induction and morphological changes in the B16F10 cells induced by different formulations of AP and AP/PTX-SLNs (arrows: cell apoptosis). Scale bar represents 20 μm.
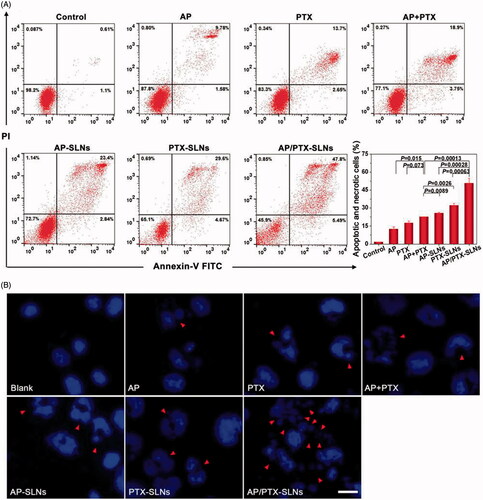
Figure 4. Drug treatment results in modulation of anti- and pro-apoptotic proteins (Bcl-2/Bax) in the B16F10 cells. (A) The cells were treated with Vc, AP, or PTX for 24 h. (B) The cells were treated with AP-SLNs, PTX-SLNs and AP/PTX-SLNs for 24 h. Densitometric measurements were assessed using LabQuant Software. The protein expression levels were normalized to those of PBS control (100%). The data are presented as the means ± SD (n = 3); *p < .05.
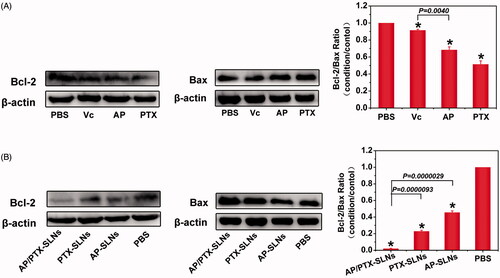
Figure 5. In vivo fluorescence images of SLNs in mice and mature SLN levels in the tumor-bearing lungs. (A) Time-dependent intensity images of the fluorescence distribution in the mice. (B) In vivo fluorescence images of major organs at 2 h after injection of SLNs.
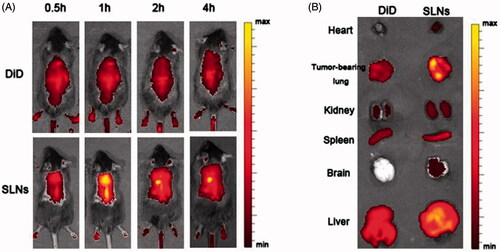
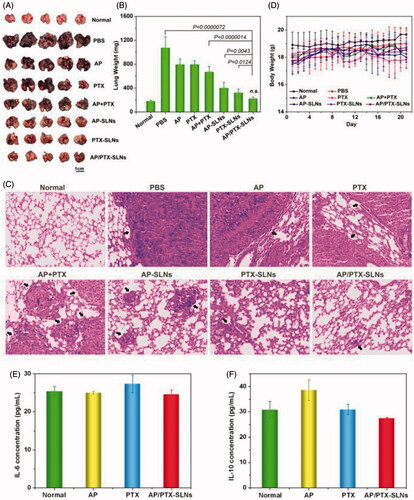
Figure 6. The improved antitumor efficiency and preliminary safety evaluation of the AP/PTX-SLNs. (A) Images of the B16F10-bearing lungs on day 21 after seven consecutive i.v. injections of AP/PTX-SLNs (n = 5). (B) The antitumoral effects of different treatments evaluated by the B16F10-bearing lung weight (n = 5); n.s., not significant. (C) Histological staining of the B16F10-bearing lungs after various treatments (arrows: tumor nodules). (D) Body weight monitoring of the B16F10-bearing mice after different treatments (n = 5). Serum concentrations of IL-6 (E) and IL-10 (F) in the C57BL/6 mice at 6 h after intravenous injection with the AP/PTX-SLNs.