Figures & data
Figure 1. (a) Schematic and (b) photograph of experimental apparatus for photopolymerization synthesis of PNIPAM nanogels and in-situ monitoring.
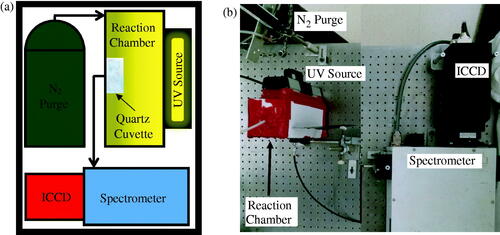
Table 1. Nomenclature of the precursor solution recipes investigated to demonstrate PNIPAM nanogel size control.
Figure 2. (a) A typical precursor solution, containing monomer, crosslinker, and photoinitiator dispersed in filtered DIW, before and after almost 35 min of UV exposure. (b) TEM of PNIPAM nanogels synthesized via UV exposure having an average size of approximately 200 nm as shown by the inset particle size distribution. (c) Intensity of the UV source as a function of elapsed exposure time quantifying the attenuation of the UV source. (d) Results of the precursor solution concentration study for demonstration of nanogel size control. This dilution study of average PNIPAM nanogel average size versus monomer to crosslinker ratio reveals that dilution leads to smaller nanogels and higher crosslinker content with respect to monomer leads to larger nanogels.
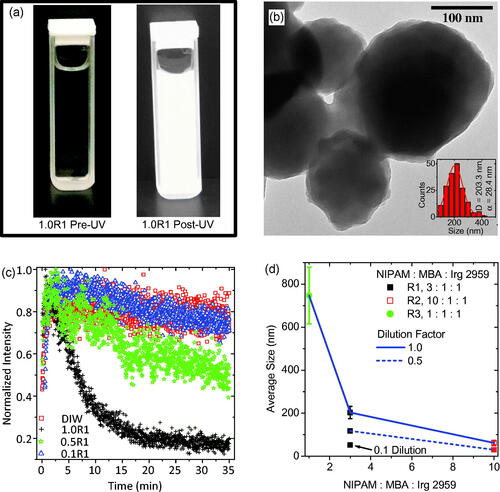
Figure 3. (a) Photographs of the precursor solution 1.0R3 with 0.2 mg mL−1 IOMNPs dispersed therein before and after being exposed to the UV source for about 35 min. (b) The transmittance of the UV source through the sample photographed in (a) as a function of elapsed exposure time. (c) TEM of the PNIPAM nanogels synthesized, in the presence of IOMNPs, via UV exposure. (d) A particle size distribution of the nanogels shown in (c) revealing an average size of approximately 1000 nm.
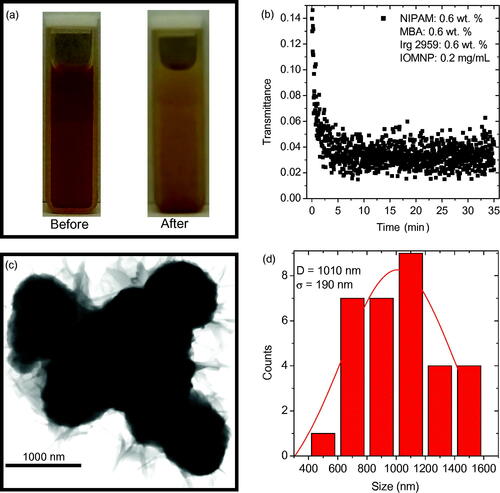
Figure 4. (a) The sample was agitated after UV exposure, thereby suspending bare IOMNPs, empty nanogels, and PNIPAM embedded IOMNPs in the water column. (b) Bare IOMNPs settle relatively fast under the influence of gravity. A static magnetic field can be made to isolate embedded IOMNPs, from the empty nanogels and bare IOMNPs, along the cuvette wall.
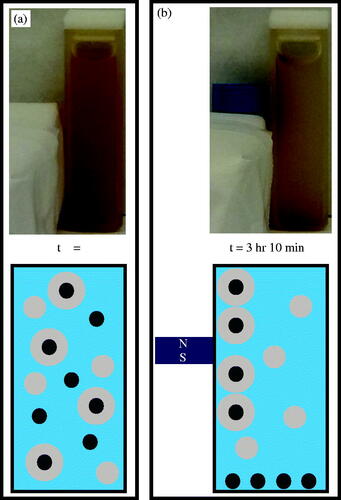
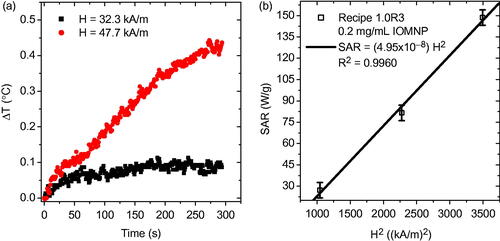
Figure 5. (a) The AMF heating curves of the sample comprised of precursor solution 1.0R3 and IOMNPs after being exposed to the UV source. (b) The SAR as a function of the square of the applied magnetic field amplitude.