Figures & data
Figure 1. Cellular competitive uptake studies. Confocal microscopy images of the cellular competitive uptake of RITC-labeled nanoparticles for 1 h (the cells were all stained with Hoechst 33342). (A) Schematic illustration of cellular competitive uptake. (B) Confocal microscopy images of the cellular competitive uptake of RITC-labeled HP-TCS nanoparticles after 1 h of incubation. All cells were stained with Hoechst 33342. A549 and NCM460 cells were labeled with PKH67 fluorescent linker and co-cultured with SKOV3 and CT26 cells, respectively. Then, the cells were incubated with HP-TCS and HP-TCS plus free TNYL. Scale bar: 50 µm. Quantitative uptake in A549 cells and SKOV3 or NCM460 cells and CT26 for this co-cultured system was measured using a flow-cytometer.
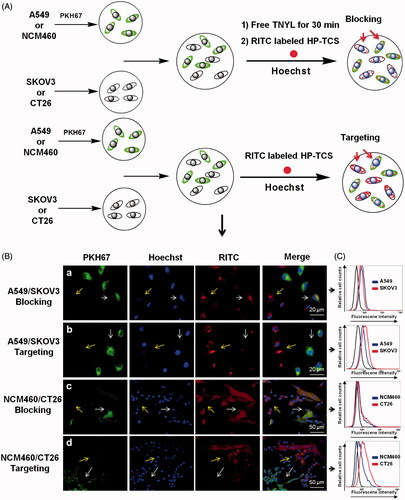
Figure 2. Bioimaging studies in orthotopic models. (A) The in vivo imaging of ICG-HP-TCS in orthotopic CT26-Luc tumor-bearing BABL/C mice model at 5 min after IP injection of D-luciferin. (B) The photograph and in vivo imaging of CT26-Luc tumor, normal colon and various tissues at 24 h after the intravenous injection of ICG-HP-TCS nanoparticles. (C) The accumulation of ICG-HP-TCS nanoparticles in various tissues was calculated as %ID/g (the percentage of the injected dose per gram of tissue). The fluorescent intensity, which indicates the amount of micelles, was read by the imaging system. (D) The accumulation of ICG-HP-TCS nanoparticles in various tissues by measuring Au element levels in tumors using ICP-MS (n = 3). *p < .05.
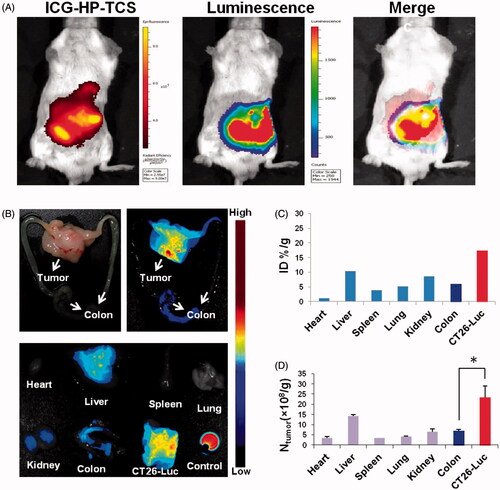
Figure 3. Immunohistochemical staining studies. (A) Immunohistochemical staining of ICG-HP-TCS nanoparticles using CD31 antibody in SKOV3, A549 and CT26 tumor vessels. (B) Immunohistochemical staining of ICG-HP-TCS micelles using EphB4 antibody in SKOV3, A549 and CT26 tumors. Nuclei were counterstained with 4,6-diamidino-2-phenylindole.
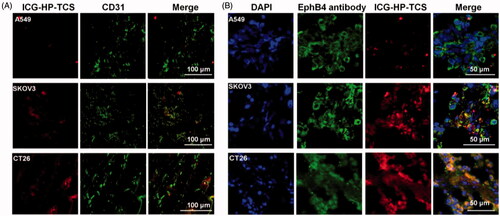
Figure 4. In vivo anti-tumor activity studies in subcutaneous SKOV3 tumor models. (A) Tumors growth curves for the mice bearing SKOV3 tumors after the intravenous injection of saline, PTX, H-TCS, P-TCS, HP-CS and HP-TCS nanoparticles. (B) The average tumor weights in different treatment groups. (C) Representative photographs of tumors in saline plus laser, PTX plus laser, P-TCS plus laser, H-TCS plus laser, HP-CS plus laser and HP-TCS plus laser groups after irradiation treatment. (D) Histologic evaluation of tumor tissues and various organs in mice treated with each treatment group after NIR laser treatment and stained with H&E. Data represent the mean ± standard deviation (n = 6). *p < .05, **p < .01 and ***p < .005.
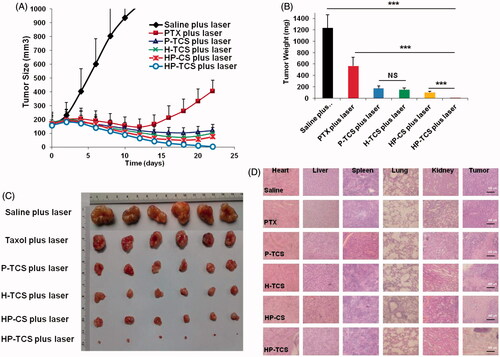
Figure 5. In vivo anti-tumor activity studies in subcutaneous CT26 tumor models. (A) Tumor growth curves for BABL/C mice bearing CT26 tumors after the intravenous injection of saline, PTX, HP-CS and HP-TCS nanoparticles, irradiated by NIR laser (1.0 W for 3 min) at 24 h. (B) The survival rate curves of BABL/C mice in saline plus laser, PTX plus laser, HP-CS plus laser and HP-TCS plus laser groups after irradiation treatment. (C) Histologic evaluation of tumor tissues and various organs in BABL/C mice treated with each treatment group at 12 days after NIR laser treatment and stained with H&E. (D) Immunological staining evaluation of tumor tissues in mice treated with each treatment group at 12 days after NIR laser treatment and stained with TUNEL and Ki67. Data represent the mean ± standard deviation (n = 6).
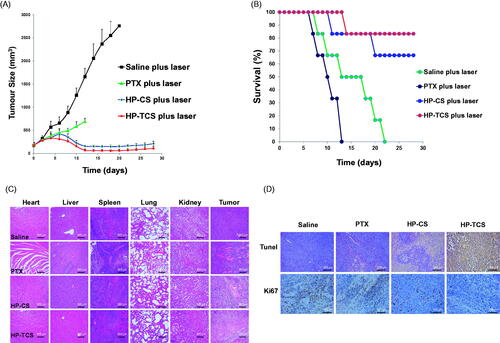
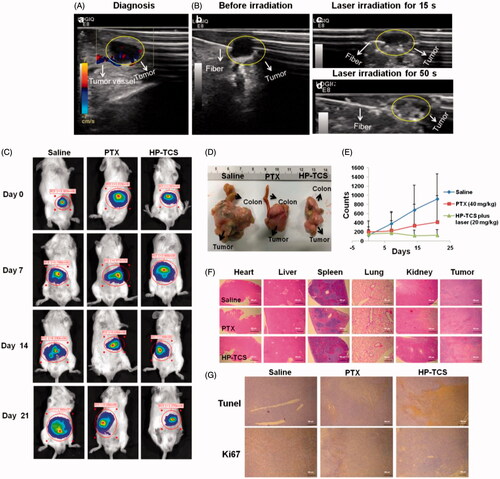
Figure 6. The in vivo anti-tumor activity studies in orthotopic CT26-Luc tumor models. (A) B mode ultrasound images of the orthotopic CT26-Luc tumor model, (a) diagnosis, (B) before irradiation (b), laser irradiation for 15 s (c) and laser irradiation for 50 s (d). (C) The in vivo imaging of BABL/C mice bearing orthotopic CT26-Luc tumors at 5 min after IP injection of D-luciferin treated with saline, PTX and HP-TCS-plus-laser under the guidance of B mode ultrasound after 0, 7, 14 and 21 days. (D) Post-autopsy representative image of CT26-Luc tumor and colon, treated with saline, PTX and HP-TCS-plus-laser at 21 days. (E) Tumor growth curves for bearing CT26-Luc tumors BALB/C mice of ‘B’; the luminescence counts were read by the in-vivo imaging systems. (F) H&E staining of CT26-Luc tumor tissues and various organs in BABL/C mice, treated with each treatment group at 12 days after NIR laser treatment. (G) TUNEL and Ki67 staining of CT26-Luc tumor tissues in mice, treated with each treatment group at 12 days after NIR laser irradiation. Data represent the mean ± standard deviation (n = 3).