Figures & data
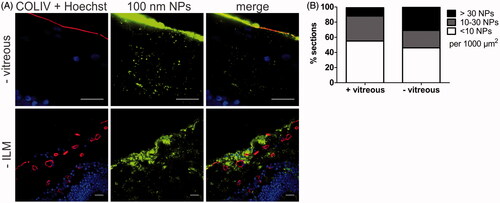
Figure 1. Schematic drawing of the vitreoretinal interface. G: Ganglion cell; ILM: inner limiting membrane; M: Müller cell; N: nerve fiber; VR: vitreoretinal.
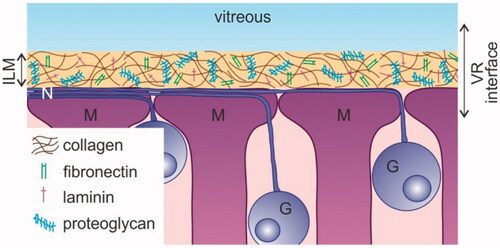
Figure 2. (A) Step-by-step overview of the dissection protocol to culture a bovine vitreoretinal explant. (B) set-up for ‘direct imaging’ of the vitreoretinal explant. (C) Workflow applied for cryosectioning of the retina and cryosection imaging.
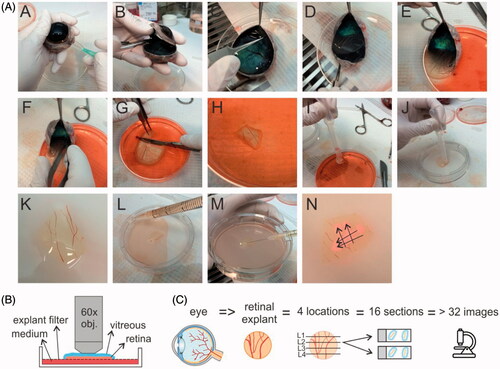
Figure 3. (A) Confocal view on the GCL/NFL layer as obtained through ‘direct imaging’. Müller cells (red) are stained with Mitotracker Deep Red, lipid membranes and nerve fibers (green) with FM-43. Scale bar: 20 µm. (B) Confocal view onto the GCL/NFL layer of different species stained for Müller cells. Bovine retinal tissue was stained by Mitotracker Deep Red (own data); examples of human, rat and rabbit tissue were stained by Mitotracker Orange and taken from (Uckermann et al., Citation2004).
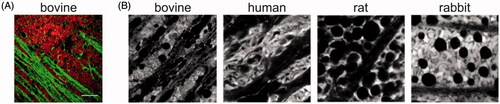
Figure 4. Cryosection imaging showing gross morphology and tissue viability of vitreoretinal explants. Nuclei are stained with Hoechst (blue), dead cells are stained with propidium iodide (red). Arrows indicate the vitreous layer. Scale bar: 100 µm.
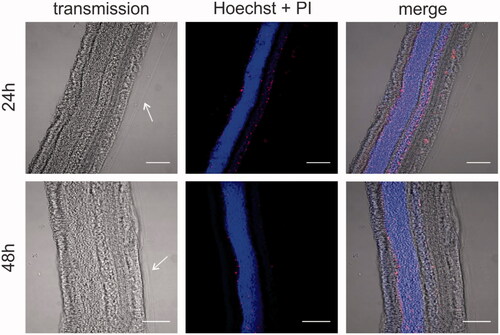
Table 1. Size and zeta-potential of the carboxylated PS beads in HEPES buffer.
Figure 5. Transfer of (green) PS beads through the VR interface, as visualized by ‘direct imaging’ (). Müller cells (red) are stained with Mitotracker Deep Red, cell nuclei (blue) with Hoechst. (A) 40 nm particles enter the Müller cells, 100 and 200 nm particles remain in the vitreous (indicated with ‘V’). Scale bar: 25 µm. For optimal contrast we refer the reader to the online version. (B) Co-localization of 40 nm PS beads (green) with Müller cells. Asterisks (*) indicate blood vessels, number signs (#) indicate nerve fibers. Scale bar: 25 µm.
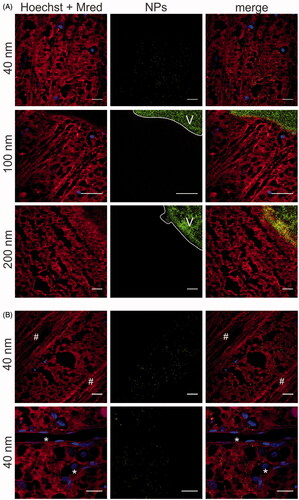
Figure 6. (A) Retinal cross-section of bovine retina with vitreous attached. Green: 100 nm polystyrene beads injected in the vitreous; Red: ILM stained for collagen, which also stains retinal blood vessels (*); Blue: Hoechst staining of nuclei. Scale bar 50 µm. (B) Representative cryosection images showing the transport of PS beads through the vitreoretinal interface, 24 h after injecting the PS beads in the vitreous of the VR explant. ILM and blood vessels are stained by anti-collagen antibodies (red), nuclei (blue) with Hoechst, particles are shown in green. Note that the contrast in the middle panel is enhanced to optimally visualize the PS beads, while the brightness of the PS beads is reduced in the right panel to illustrate the perfect alignment of the vitreous and ILM. For optimal contrast we refer the reader to the online version. The scale square in the top left image represents 1000 µm2 (31.6 µm × 31.6 µm). Scale bar: 31.6 µm. (C) Semi-quantitative analysis of transport of PS beads through the VR interface after 24 h incubation. (n = 3).
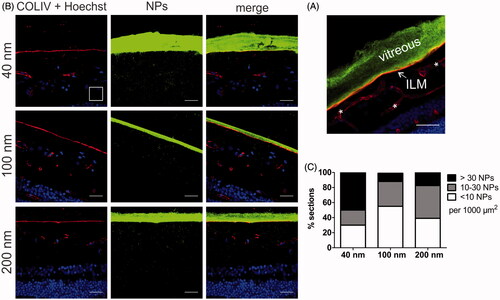
Figure 7. (A) Representative cryosection images showing the transport of 100 nm sized PS beads into the retina, 24 h after applying the beads on the explants. Top row: no vitreous, bottom row: no ILM. ILM and blood vessels (red) are stained by anti-COLIV antibodies, nuclei (blue) with Hoechst, particles are shown in green. Scale bar: 20 µm. (B) Semi-quantitative analysis of 100 nm PS bead uptake in vitreoretinal explants compared to conventional explants without vitreous (n = 3).