Figures & data
Figure 1. Loading of DOX conjugates into MSCs and drug release. (A) Morphology of BPCD/MSCs and iRGD-BPCD/MSCs under confocal microscope (green fluorescence represented FITC-labeled avidin, red fluorescence represented DOX, and yellow fluorescence indicated the co-localization of FITC and DOX). (B,C) Drug release curves of loaded MSCs under pH 7.4 and 6.0. (D) MSC viability after drug release. The results are presented as the mean ± SD (n = 3).
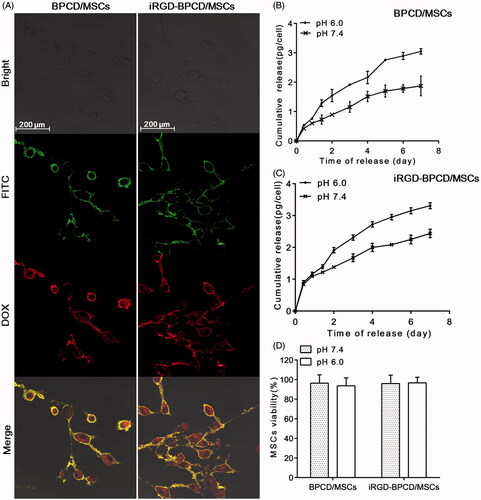
Figure 2. Stability of BPCDП on MSC surface (green fluorescence represented FITC-labeled avidin, red fluorescence represented DOX, and yellow fluorescence indicated the co-localization of FITC and DOX).
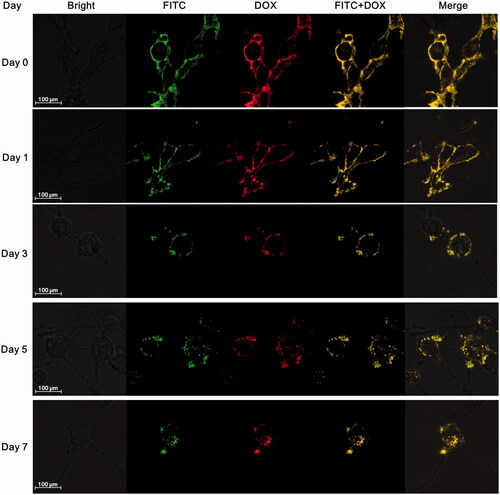
Figure 3. Characterization of drug-loaded MSCs. (A) The effect of drug loading process on the MSC viability, group 1: only endocytosis; group 2: only membrane binding; and group 3: combination of endocytosis and membrane binding. (B) The effect of drug loading on MSC adhesion and proliferation. (C) Osteogenic and adipogenic differentiation of BPCD/MSCs and iRGD-BPCD/MSCs; calcium deposits were stained red by alizarin red in osteogenesis, and neutral lipid vacuoles were stained dark red by Oil Red O in adipogenesis. MSCs cultured in regular medium were set as control. The results are presented as the mean ± SD (n = 6). *p < .05; N.S.: not significant.
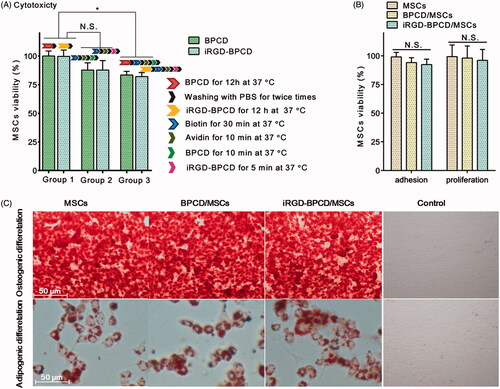
Figure 4. Effect of drug loading on MSC migration. (A) The migration of loaded and unloaded MSCs toward 4T1 clusters, 4T1 toward 4T1 and MSCs toward MSCs was set as control (red fluorescence represented DOX). (B) Microscopic images of loaded and unloaded MSCs migrating through the Transwell membrane toward 4T1-CM, control was MSCs migrated toward fresh serum-free medium, and blue point represented the nucleus of migrated MSCs. (C) The cell amount of the migrated MSCs. HPF was short for high power field. Data were expressed as mean ± standard deviation (n = 6). *p < .05, ***p < .001.
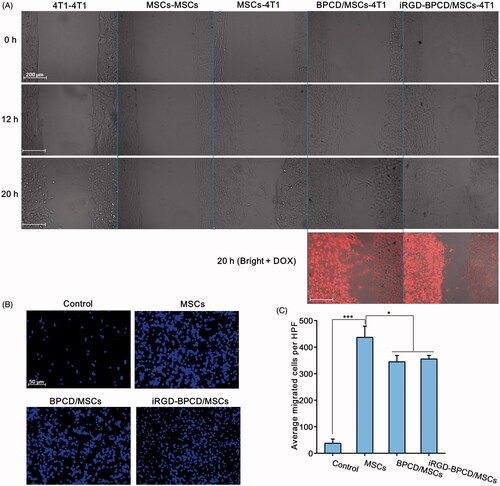
Figure 5. The effect of drug loaded on MSC distribution and retention. (A) The distribution and retention of loaded and unloaded MSCs in vivo and MSCs labeled by DIR. (B) Ex vivo imaging of major organs harvested from lung tumor-bearing mice 24 h after the intravenous injection of MSCs and BPCD/MSCs. (C) The accumulation of MSCs and BPCD/MSCs in major organs was quantified by the radiant efficiency and cell number (n = 6). (D) Microscopic images of histological sections from lung metastasis of breast cancer-bearing mice, blue fluorescence indicated the nuclei of tumor cells, green represented MSCs, red represented DOX, and purple indicated the co-localization of nuclei, MSCs and DOX.
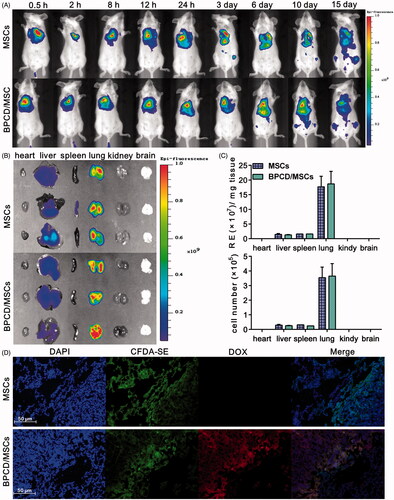
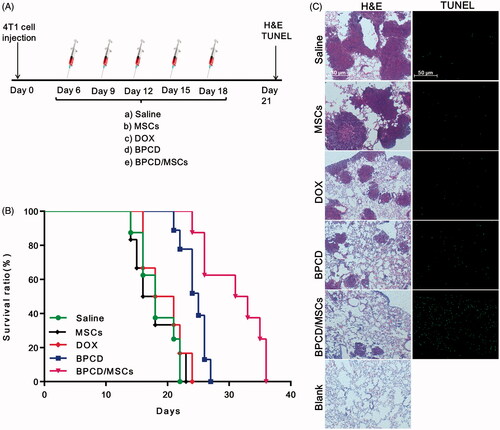
Figure 6. The antitumor effect of BPCD/MSCs in vivo. Saline, MSCs, DOX, BPCD and BPCD/MSCs were systemically administrated after tumor implantation. (A) Illustration of the dosage regime. (B) Kaplan–Meier survival curve of lung metastasis of breast cancer-bearing mouse. (C) H&E sections and TUNEL staining of lung tissues from mice for breast cancer lung metastasis (normal mouse lung as blank), the network structures were alveoli, the deeper color region with a great number of cells tightly clustered together was tumor cells, and green represents the apoptotic cells.