Figures & data
Table 1. Composition, particle size and DEE of DCNP as per experimental design.
Figure 1. (a) 3D response surface graph of DCNP showing the effect of chitosan and Tween 80 on particle size. (b) 3 D response surface graph of DCNP showing the effect of chitosan and Tween 80 on DEE. (c) Overlay plot showing the location of optimized batch of DCNP.
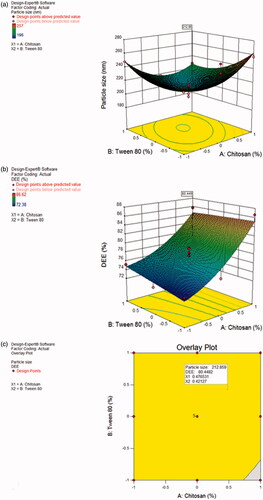
Figure 2. TEM image of DCNPopt.
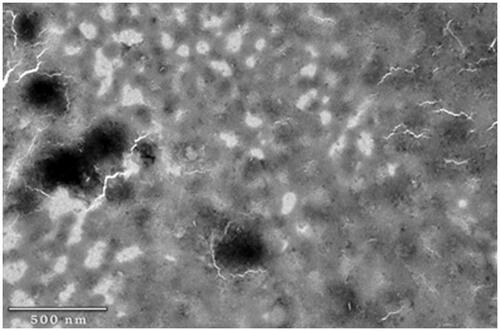
Figure 3. FTIR spectra of (A) Chitosan (B) Doxycycline hydrochloride (C) DCNPopt.
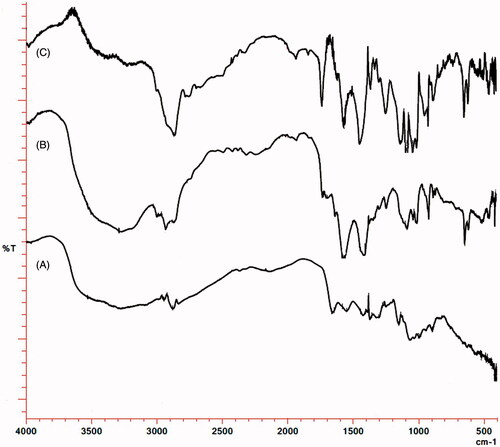
Table 2. Effect of doxycycline hydrochloride and DCNPopt on various behavioral and biochemical parameters.
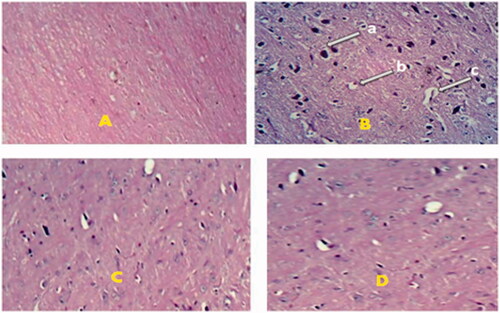
Figure 4. Effect of DCNPopt on histopathological changes of brain. A = Vehicle treated brain, B = Ketamine treated brain, C = Doxycycline hydrochloride treated brain, D = DCNPopt treated brain. ‘a’ – hyperchromatic nuclei, ‘b’ – perinuclear vacuolization, ‘c’ – dilated vascular channels.