Figures & data
Figure 1. (A) Particle size and size distribution of PLGA NPs and LC-PLGA NPs, (n = 3); (B) In vitro release profiles of free 5-FU, 5-FU-loaded PLGA NPs and LC-PLGA NPs (n = 3); (C) TEM image of PLGA NPs; (D) TEM image of 10% LC-PLGA NPs.
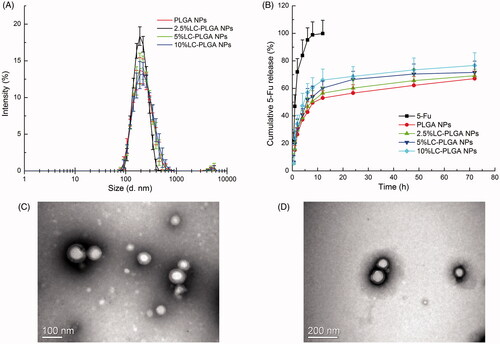
Figure 2. (A) Expression of OCTN2 (SLC22A5) and ATB0,+ (SLC6A14) proteins in MB231, MCF7 and Caco-2 cells, with β-actin as an internal control; (B) Uptake of coumarin 6 from bare nanoparticles (PLGA NPs) and L-carnitine conjugated nanoparticles (LC-PLGA NPs) in these three cell lines; (C) Effect of Na+ and Cl– on the uptake of coumarin 6 from LC-PLGA NPs; (D) Effect of specific inhibitors (α-MT and glycine for ATB0,+, L-carnitine for OCTN2) on the uptake of coumarin 6 from LC-PLGA NPs. Data are shown as mean ± SD, n = 3. *, p < .05, **, p < .01, ***, p < .001, compared to uptake in NaCl buffer (C, D).
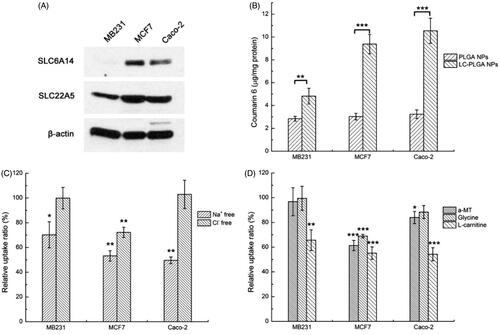
Figure 3 , Fluorescent images of the colocalisation for LC-PLGA NPs and OCTN2/ATB0,+ in MCF7 cells (A, B, E, F) and Caco-2 cells (C, D, G, H). Coumarin 6 (green) was used to label LC-PLGA NPs, and Alexa Fluor® 594 (red) conjugated secondary antibody was used to mark OCTN2 or ATB0,+, and DAPI (blue) was used to show the nucleus. A, B, C, D for 15 min incubation, and E, F, G, H for 30 min incubation. In MCF7 cells, A and E show the colocalisation of LC-PLGA NPs with ATB0,+, and B and F show the colocalisation of LC-PLGA NPs with OCTN2; In Caco-2 cells, C and G show the colocalisation of LC-PLGA NPs with ATB0,+, and D and H show the colocalisation of LC-PLGA NPs with OCTN2. Arrowheads show the colocalisation of LC-PLGA NPs and transporters (yellow, green + red). Dashed lines mark the cell borders.
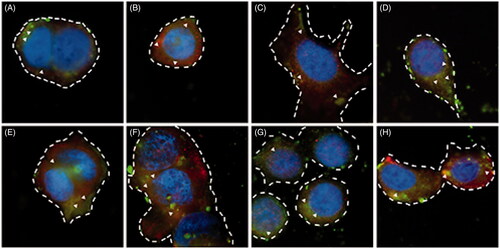
Figure 4. (A) Expression of OCTN2 (SLC22A5) and ATB0,+ (SLC6A14) in the normal colon cell line (CCD841) and colon cancer cell lines (Caco-2, HCT116, HT29, LS174T); (B) Uptake of coumarin 6 from LC-PLGA NPs with different ligand density (0 to 10%) in colon cells. Data are shown as mean ± SD, n = 3. *, p < .05, **, p < .01, ***, p < .001, compared to uptake in normal colon cells (CCD841).
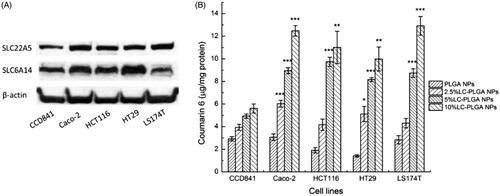
Figure 5. The MTT assay for 5-FU, 5-FU-loaded PLGA NPs and 5-FU-loaded LC-PLGA NPs in CCD841 (A); Caco-2 (B); HCT116 (C); HT29 (D); and LS174T (E); (F), the calculated IC50 values. Data are shown as mean ± SD, n = 3. *, p < .05, **, p < .01.
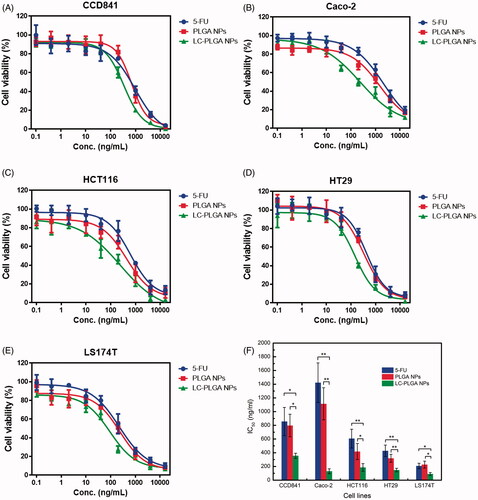
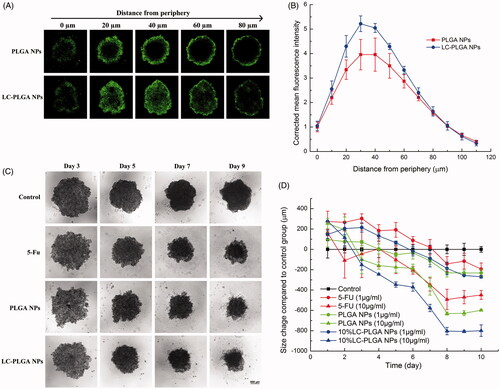
Figure 6. (A) Nanoparticle penetration of spheroids. Z-stack images taken by confocal microscopy showing penetration of coumarin 6-labeled PLGA NPs and LC-PLGA NPs in HCT116 spheroids. Green color indicates coumarin 6-labeled nanoparticles; (B) Corrected coumarin 6 flourescence intensity represents the nanoparticles in spheroids from periphery to the inner layer (n = 3); (C) Morphological change in HCT116 spheroids during 10-day treatment with 10 µg/mL of free 5-FU, 5-FU-loaded PLGA NPs and 5-FU-loaded LC-PLGA NPs; (D) Compared to control group, the size change of HCT116 spheroids treatment with 1 µg/mL and 10 µg/mL of free 5-FU, 5-FU-loaded PLGA NPs and 5-FU-loaded LC-PLGA NPs (n = 3).