Figures & data
Figure 1. Preparation and characterization of FK506M. (a) Scanning electron microscopy, scale bar =10 μm. (b) X-ray powder diffraction (XRD). (c) Differential scanning calorimetry (DSC). (d) Fourier transform infrared spectrometry (FTIR). (e) In vitro release of FK506 from FK506M in phosphate--buffered saline (pH 7.4) containing 0.5% Tween 20. The solid line indicates release profile of FK506 when the microspheres were incorporated with Matrigel and the dotted line indicates the release profile without Matrigel. The values represent means ± standard deviations (SD), n = 3. (f) In vitro cytotoxicity (MTT) assays of blank PLGA microspheres on INS-1 cells. The values represent means ± SD, n = 8.
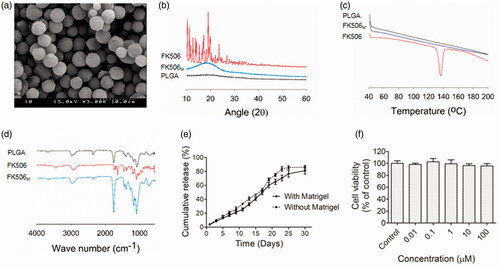
Figure 2. Pharmacokinetics study of FK506M on male Sprague Dawley rats. The rats were subcutaneously injected with 10 mg/kg of FK506P suspended in Matrigel (open circle, n = 4) and 10 mg/kg of FK506M suspended in Matrigel (closed circle, n = 4). The values represent means ± standard deviations (SD).

Figure 3. Transplantation of rat pancreatic islets in diabetic C57BL/6 mice. (a) Experimental groups. (b) Non-fasting blood glucose (NBG) level of the mice transplanted with islets (islet; n = 4). (c) NBG level of the mice transplanted with islets and FK506P (10 mg/kg) at the same site (islet-FK506P; n = 5). (d) NBG level of the mice transplanted with islets and FK506M (10 mg/kg) at the same site (islet-FK506M; n = 5). (e) NBG level of the mice transplanted with islets and FK506M (10 mg/kg) on different sites (islet-FK506M#; n = 5). Arrows at day 30 indicate the day of retrieval of Matrigel. Each line indicates blood glucose profile of an individual mouse. (f) Kaplan–Meier curve for graft survival time. Graft survival time in islet-FK506M increased significantly compared to that of the islet-only transplanted group (p = .00013). (g) Intraperitoneal glucose tolerance test (IPGTT) in diabetic mice (open circle; n = 4), normal mice (closed circle; n = 5), islet–FK506M transplanted diabetic recipients on day 14 of transplantation (open triangle; n = 5), and islet–FK506M transplanted diabetic recipients on day 28 of transplantation (closed triangle; n = 3). The values represent means ± SD.
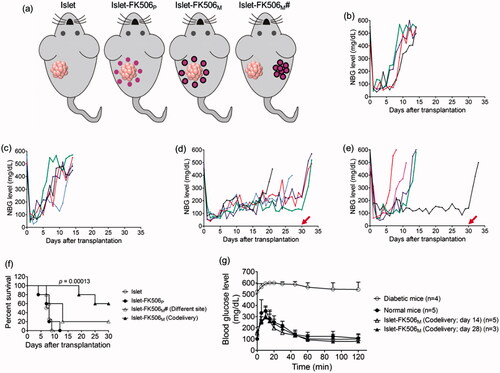
Figure 4. Measurement of insulin and proinflammatory cytokine levels in serum and Matrigel. (a) Serum insulin levels in different groups of mice. (b) Quantification of insulin per unit weight of Matrigel containing the transplanted islets after retrieval. (c) Quantification of TNF-α per unit weight of the Matrigel. In islet (n = 4) and islet–FK506P (n = 5) recipients, the Matrigel was retrieved on day 15 post-transplantation. In islet–FK506M recipients (n = 3), the Matrigel was retrieved on day 30 post-transplantation. TNF-α was not detected in the serum of any of the groups. The values represent means ± SD.
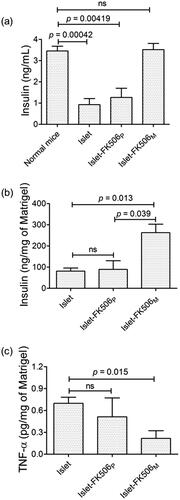
Figure 5. Immunohistochemistry analysis. H&E staining shows intact morphology of the islets inside the Matrigel of islet–FK506M group. In addition, intense stain due to insulin was observed in the islet–FK506M group compared to that of islet recipients. Higher proportion of CD3 (indicated by arrows) and CD68 (indicated by arrows) positive cells were observed in islet group compared to that of the islet–FK506M group. In islet recipients, the Matrigel was retrieved on day 15 post-transplantation. In islet–FK506M recipients, the Matrigel was retrieved on day 30 post-transplantation.
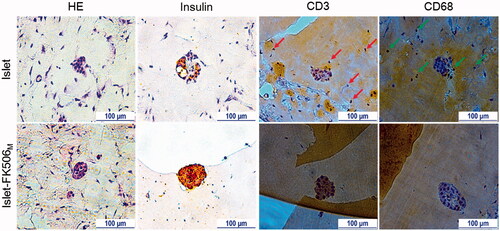
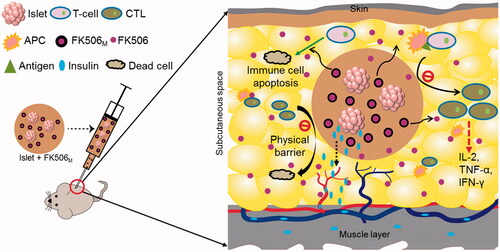
Figure 6. Schematic representation of immune protection protocol for local codelivery of pancreatic islets and FK506M. FK506 releases in a long-term from the microspheres inside the Matrigel containing islets. The release of FK506 at the local microenvironment inhibits the activation of T-cells. FK506 also has activity to cause apoptosis of T-cells. In addition, the solidified Matrigel may also act a physical barrier to massive infiltration of immune cells. The insulin secreted by the islets inside the hydrogel diffuses to the nearby blood vessels to reach the systemic circulation. CTL: cytotoxic T-lymphocytes; APC: antigen-presenting cell; FK506M: FK506-loaded poly(lactic-co-glycolic acid) microspheres.