Figures & data
Figure 1. Characteristics of ES-loaded NPs. (A) The fabrication process of ES-NPs. ES-loaded chitosan nanoparticles were prepared using ionic cross-linking method with dropwise addition of TPP to a chitosan solution. (B) Size distribution of the ES-NPs. The results showed that the particles were 223.45 ± 5.1 nm in diameter. (C) TEM images of ES-NPs.
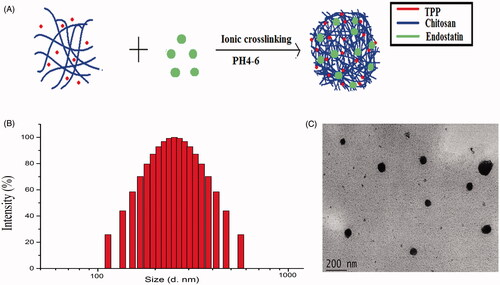
Figure 2. In vitro drug release of ES-NPs in two PBS solutions of different pH (A). The formulation stability of ES-NPs with (B) or without (C) mouse serum at 4 °C, 37 °C, or room temperature (RT).
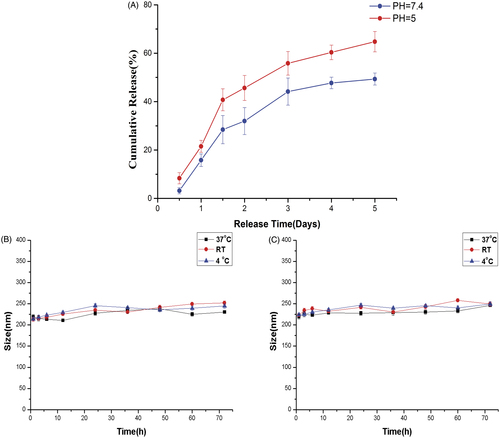
Figure 3. Tumor growth in subcutaneous Lewis lung cancer model. (A) Suppression of subcutaneous tumor growth in each group. (B) The final tumor volume on day 21.
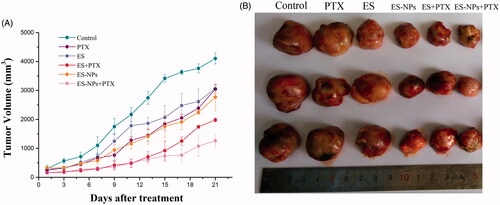
Figure 4. Serum ES (A) and VEGF (B) levels of each group. Mice in each group were sacrificed on day 21 and blood samples were collected to detect serum ES and VEGF levels by ELISA. ap < .05 versus the control; bp < .05 versus the ES group.
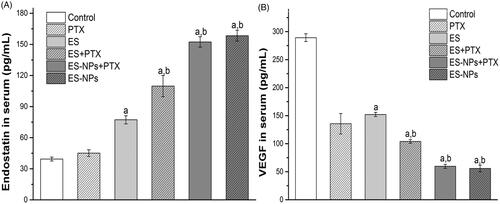
Figure 5. Ki-67 immunohistochemical staining in tumors. (A) Ki-67 immunohistochemical images of tumor tissue from mice in various groups. (B) Ki-67 quantitative analysis in xenografts from mice in various groups. Original magnification, 400×.
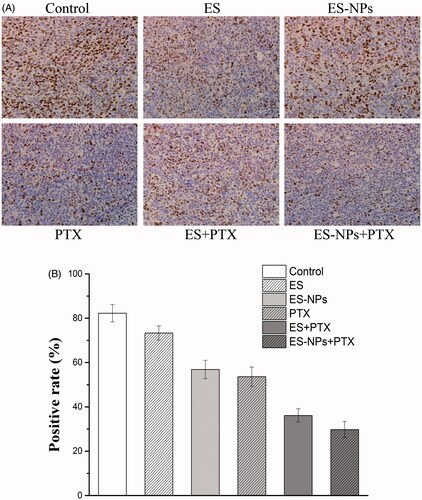
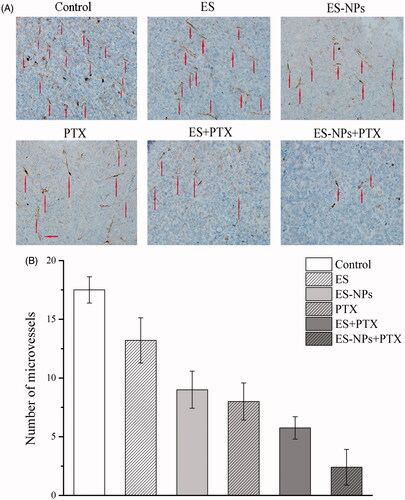
Figure 6. CD31 immunohistochemical staining of tumors. (A) CD31 immunohistochemical images of tumor tissue from mice in various groups. (B) CD31 quantitative analysis in xenografts from mice in various groups. Original magnification, 400×.