Figures & data
Figure 1. Design of Pep-1 and CREKA dual-conjugated PEG-PLGA nanocarrier (PC-NP) for glioma targeting delivery based on the strong binding capacity of CREKA to fibrin–fibronectin complexes and IL-13Rα2-mediated endocytosis.
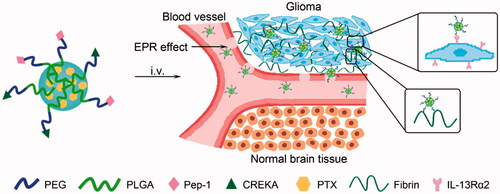
Figure 2. TEM image (A) and particle size distribution (B) of PC-NP-PTX. PTX release profiles of various nanoparticles in PBS (pH 5.0) (C) and PBS (pH 7.4) (D) with 0.5% (w/v) Tween 80.
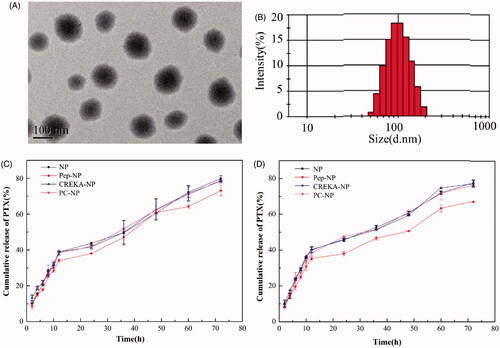
Figure 3. Cellular uptake assay of nanoparticles. (A) Fluorescent microscopy image showing the cellular uptake of coumarin-6-labeled (10, 20 and 40 ng/mL) NP, Pep-NP, CREKA-NP and PC-NP by U87MG cells after incubation at 37 °C for 1 h. Bar: 100 μm. (B) Uptake of various coumarin-6-labeled (200–1000 ng/mL) nanoparticles by U87MG cells at 37 °C for 1 h as determined by HPLC. (C) Uptake of various coumarin-6-labeled (500 ng/mL) nanoparticles by U87MG cells at 37 °C for 0.5–4.0 h as determined by HPLC. Data are presented as mean ± SD (n = 3). *p < .05 vs NP, **p < .01 vs NP, ***p < .001 vs NP.
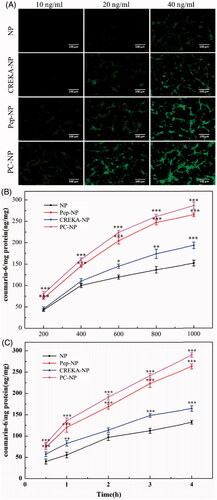
Figure 4. Cytotoxicity studies of Taxol®, NP, Pep-NP, CREKA-NP and PC-NP in U87MG cells after incubation for 48 h (n = 6). ***p < .001, **p < .01, *p < .05.
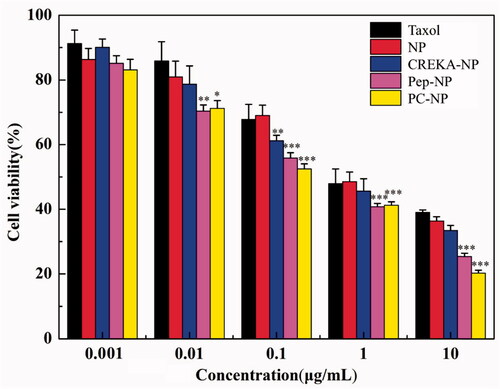
Figure 5. In vitro binding of various nanoparticles to FFP clots. (A) IVIS spectrum imaging and (B) corresponding radiant efficacy of FFP clots or CREKA-pretreated FFP clots after incubation with PBS (control) and DiR-labeled nanoparticles (NP, CREKA-NP, Pep-NP and PC-NP). Values were means ± SD, n = 3. ***p < .001 compared with NP group, ###p < .001 compared with CREKA + PC-NP group.
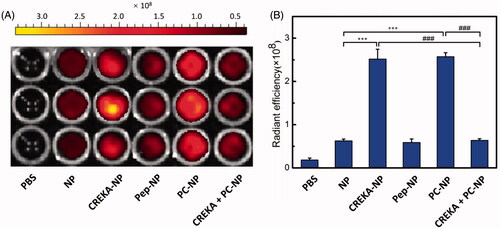
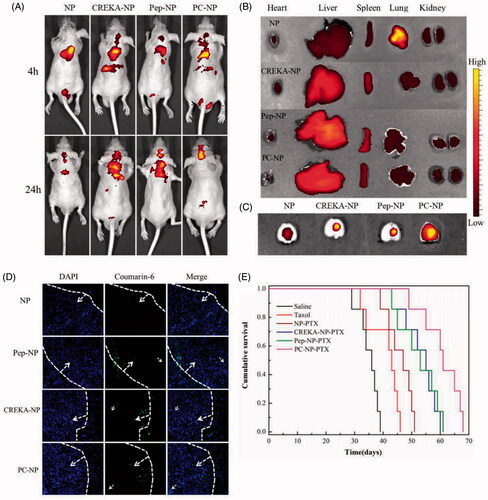
Figure 6. In vivo distribution and anti-GBM efficacy of nanoparticles in U87MG glioma-bearing nude mice. (A) In vivo real-time fluorescence imaging of U87MG glioma-bearing nude mice administrated with DiR-labeled NP, CREKA-NP, Pep-NP and PC-NP at two different time points (4 h and 24 h). (B) (C) Ex vivo fluorescence imaging of organs and brains sacrificed 24 h after treatment. (D) In vivo distribution of various coumarin-6-loaded nanoparticles in glioma sections of U87MG glioma-bearing nude mice. Dash lines: border of the glioma. Original magnification: ×20. (E) Kaplan–Meier survival curves for U87MG glioma-bearing mice treated with different PTX formulations at a dose of 10 mg/kg PTX on day 2, 4, 6 and 8 post-implantations.