Figures & data
Figure 1. Thin-film method to prepare empty POCA4C6 micelles (PM) and curcumin-loaded POCA4C6 micelles (CPM). Size distributions of (a) PM and (b) CPM based on dynamic light scattering. Transmission electron micrographs of (c) PM and (d) CPM. (Scale bar, 10 nm, 1 nm in inset).
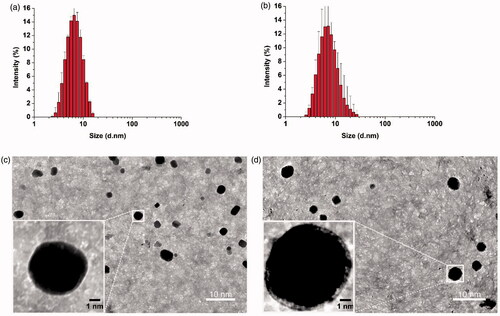
Table 1. Characterization of empty POCA4C6 micelles and CPM.
Figure 2. Release profiles and uptake behavior in vitro. (a) Fluorescence emission spectra of curcumin release from CPM at pH 7.4 and 5.5, for different time periods from 0 to 24 h. (b) Cellular uptake of empty micelles (PM), free curcumin, or CPM by BT-549 cells (magnification, 200×). (c) Quantitative evaluation of fluorescence intensity in treated BT-549 cells based on flow cytometry. (d) Uptake of PM, curcumin or CPM by BT-549 spheroids (magnification, 160×). (e) Quantitative evaluation of fluorescence intensity in treated BT-549 spheroids using flow cytometry.
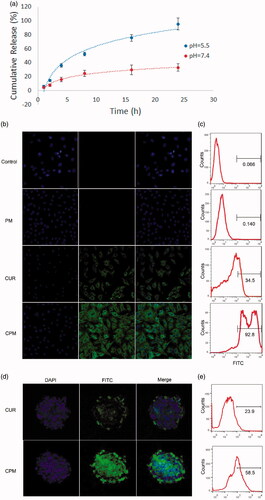
Figure 3. Effects of empty micelles (PM), free curcumin (CM) or CPM on viability, apoptosis and cell cycle of BT-549 and MCF-7 cells. Dose-response curves and IC50 values in (a,b) BT-549 and (c,d) MCF-7 cells. Effects on apoptosis in (e) BT-549 and (g) MCF-7 cells. Effects on cell cycle distribution in (f) BT-549 and (h) MCF-7 cells. CPM enhanced the cytotoxicity of doxorubicin (DOX) in (i) BT-549 and (j) MCF-7 cells following 48 h treatment with the indicated DOX concentrations with or without 2 μM CPM. Cell viability was measured using an MTT assay. Combination index (CI) values were determined using CalcuSyn V1.0 software (BIOSOFT).
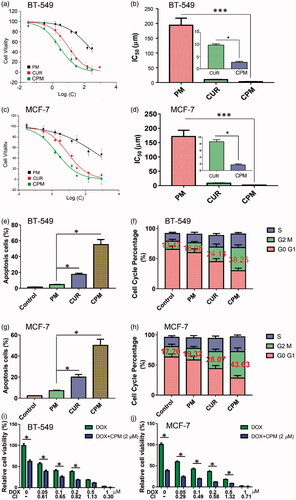
Figure 4. CPM effects on invasion, migration, sphere formation activity, as well as androgen receptor and β-catenin levels in BT-549 cells. (a) Typical images showing inhibition of BT-549 cell invasion by different formulations( magnification, 40×). (b) Quantitation of BT-549 cell invasion. (c) Cells were scratched with a pipette tip, photographed (0 h), then treated with empty micelles (PM), free curcumin or CPM. The control group was left untreated. After incubation in fresh culture medium for another 18 h, migration was photographed under phase-contrast microscopy (Scale bar, 100 μm). (d) Quantitation of gap distance. Ratios of the gap distance relative to the gap at 0 h were plotted. (e) Typical micrographs showing morphology of BT-549 spheroids after treatment with various formulations for 10 days (Magnification, 200×). (f) Relative BT-549 spheroid diameter (normalized to diameter on day 1) after treatment with various formulations. (g) CPM reduced levels of androgen receptor and β-catenin in BT-549 cells. Shown are nuclear and cytosolic levels of these and other proteins in BT-549 cells following treatment with PM, curcumin or CPM. Control cells were left untreated. CPM treated cells showed significantly lower levels of nuclear androgen receptor than the other two treatment groups.
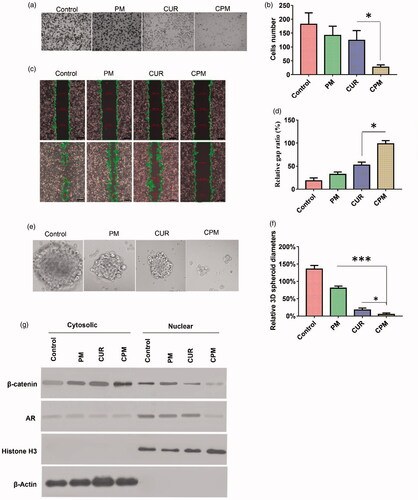
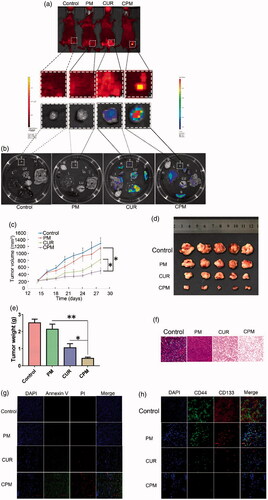
Figure 5. Ex vivo fluorescent images and in vivo anti-tumor efficacy. CPM preferably accumulated in TNBC xenografts in mice. (a) CPM accumulated at the tumor site at 24 h after intratumoral injection. Curcumin fluorescence was detected using the PerkinElmer IVIS instrument. (b) Empty micelles (PM) and free curcumin accumulated less efficiently in the tumor than CPM. CPM accumulated specifically in the tumor as shown by ex vivo imaging of organs harvested at 24 h after intratumoral injection. Images show fluorescence intensity overlaid on the tissue; the corresponding intensity scale is shown at the side of each image. B: brain; H: heart; I: intestine; L: liver; Lu: lung; K: kidney; S: spleen; T: tumor. Anti-tumor capacity of different formulations in BALB/c nude mice bearing BT-549 human breast cancer xenografts. (c) Tumor volumes of mice treated with PM, free curcumin or CPM. Negative control animals were treated with 0.9% saline. (d) Images of the corresponding BT-549 tumors. (e) Weight of excised BT-549 tumors in different groups after treatment. (f) H&E staining of tumor tissues from mice on day 14 after treatment( magnification, 20×). (g) Staining of early apoptosis (annexin V) and late apoptosis (PI) in tumors collected on day 14. (h) Immunohistochemical staining of CD44 and CD133 in tumors from mice after different treatments. CPM reduced expression of both markers (Magnification, 20×).