Figures & data
Figure 1. Establishment of small intestinal organoids culture system. Small intestinal crypts were isolated from C57BL/6 mouse small intestine, and were induced with cytokines to develop small intestinal organoids. (A) Time course of an isolated single crypt growth. (B) 3D reconstruction from these serial images. Scale bar: 50 µm.
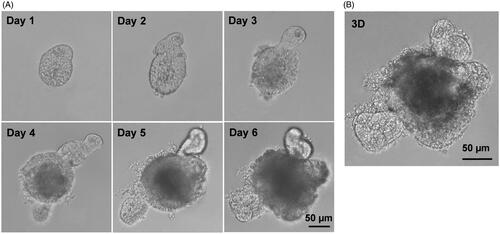
Figure 2. The expression of BCRP mRNA in organoids from different segments of small intestine. (A) Schematic of approaches to divide the small intestine into three segments. The small intestinal crypts and villus were isolated from the three segments, and then organoids were cultured from the three parts of crypts, respectively. (B) The mRNA levels of BCRP in the cultured organoids, crypts and villus from proximal, middle and distal small intestine. All data were presented as mean ± SEM (n = 3), *p ≤ .05 and **p ≤ .01.
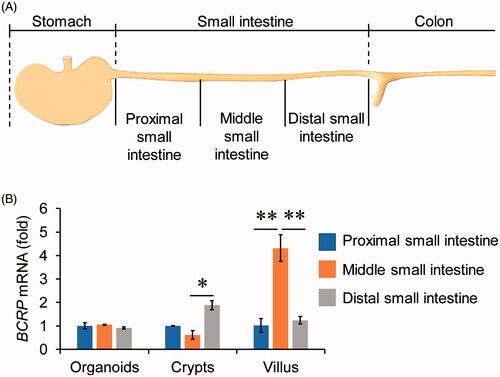
Figure 3. The analogies of BCRP expression profiling between small intestinal villus and organoids. (A) Location of BCRP protein was detected by immunohistochemistry in small intestinal villus and the cultured organoids, and were indicted by arrowheads. (B) The mRNA levels of BCRP in organoids at the fourth cultured day, villus and crypts from small intestine. (C) The mRNA expression of BCRP in the organoids on the different days of culture. All data were presented as mean ± SEM, n = 3 per group.
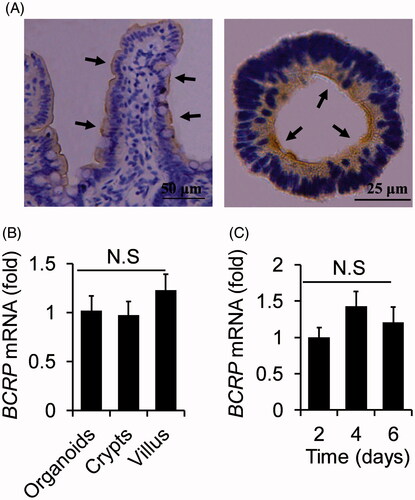
Figure 4. BCRP-mediated Hoechst 33342 transport in organoids. Fluorescence intensity of Hoechst 33342 were detected by Fluorescence microplate reader under the condition of λex/λem = 350 nm/460 nm. (A) Good liner relationship was obtained over the range of 4.9–312.5 nM for Hoechst 33342 in PBS. (B) The concentration of Hoechst 33342 released from inner of the cultured organoids at different time-points. All data were presented as mean ± SEM, n = 3 per group. *p ≤ .05 and **p ≤ .01 when compared to vehicle.
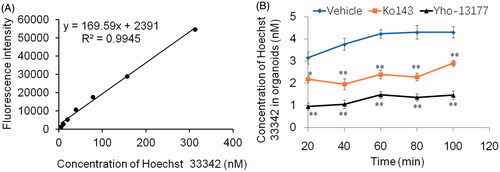
Figure 5. Fluorescent substrates accumulate in the organoids. The organoids were incubated in Hoechst 33342 with or without YHO-13177 or Ko143 for 20, 60 and 100 minutes, respectively. Ko143 and YHO-13177 notably decreased the fluorescence intensity of Hoechst 33342 in the organoids. Scale bar: 50 µm.
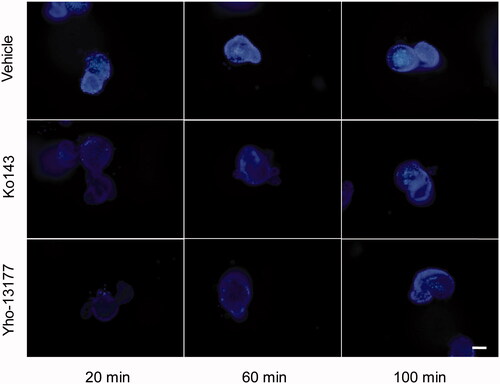
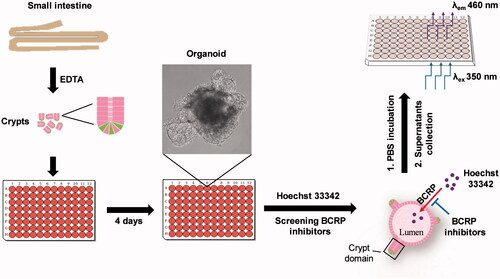
Figure 6. Schematic of approaches to screen inhibitors of BCRP using Hoechst 33342 transport in intestinal 3 D organoids. The crypts were isolated from mouse small intestine, and cultured to develop 3 D organoids. The cultured organoids were treated in BCRP fluorogenic probe substrate Hoechst 33342 with or without interesting compounds. The fluorescence intensity of Hoechst 33342 released from inner of the organoids was detected by microplate reader and the concentrations were calculated to screen inhibitors of BCRP.