Figures & data
Figure 1. Preparation of p(AAPBA-co-NVCL) and porous PLGA microspheres. (A) The synthesis process for p(AAPBA-co-NVCL); (B) A schematic representation of the preparation of porous PLGA microspheres; (C) 1H-NMR spectra of (a) NVCL, (b) AAPBA and (c) p(AAPBA-b-NVCL); (D) SEM images of exemplar insulin-loaded PLGA particles ((a) ×1500; (b) ×10,000)
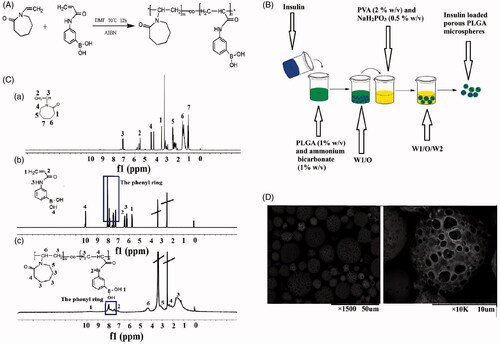
Figure 2. Preparation and images of the multilayer microspheres; (A, B) Schematics illustrating the synthetic procedure; (C) Digital photographs after (a) two, (b) four, (c) eight and (d) 12 alternating layers being deposited; (D) SEM images of particles coated with (a) two, (b) four, (c) eight and (d) 12 alternating layers; (E) TEM images of the PLGA microspheres (a) after synthesis and (b) after coating with eight alternating layers of PVA and p(AAPBA-co-NVCL).
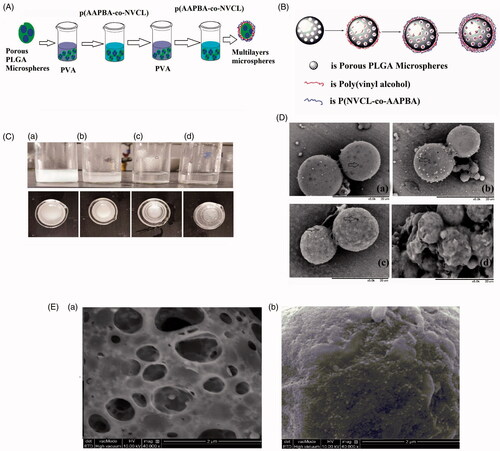
Figure 3. Characterization of the multilayer microspheres. (A) The change in zeta potential during the LbL process; (B) FTIR spectra; (C) DSC traces (exo up); (D) XRD patterns. Legend: (a) Insulin; (b) p(AAPBA-co-NVCL); (c) PVA; (d) PLGA; (e) porous PLGA microspheres; (f) multilayer microspheres; and, (g) insulin loaded multilayer microspheres.
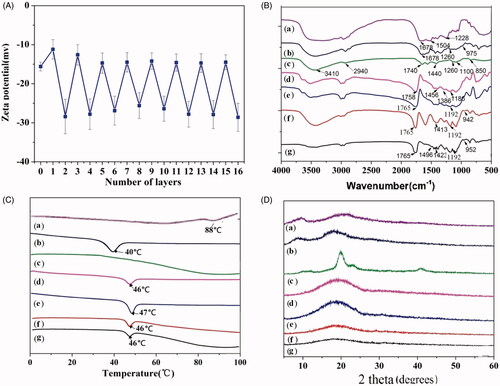
Figure 4. In vitro drug release from the insulin loaded microspheres. (A) Insulin release at varied glucose concentrations: (a) constant concentration throughout; (b) initially no glucose and then transfer to high-glucose conditions; and (c) Initially high-glucose then transfer to a glucose-free medium. Experiments were performed in triplicate and data are plotted as mean ± SEM. (B) CD spectra of insulin released from the multilayer microspheres after 6 hours and fresh insulin. (C) SEM images of the particles after insulin release for 5, 15 and 25 days from (a, c and e) the porous PLGA microspheres and (b, d and f ) multilayer microspheres.
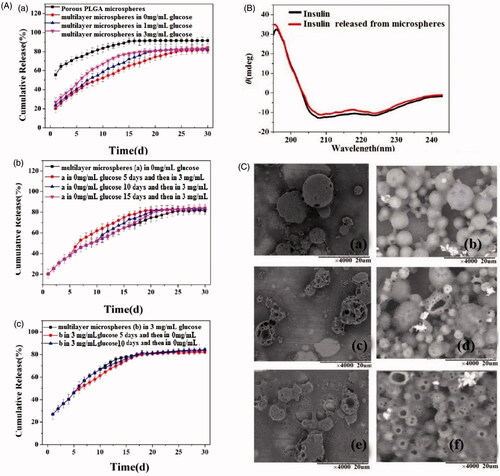
Figure 5. HE staining of the liver, kidney, heart, spleen and lung in mice. Images are at 200 × magnification.
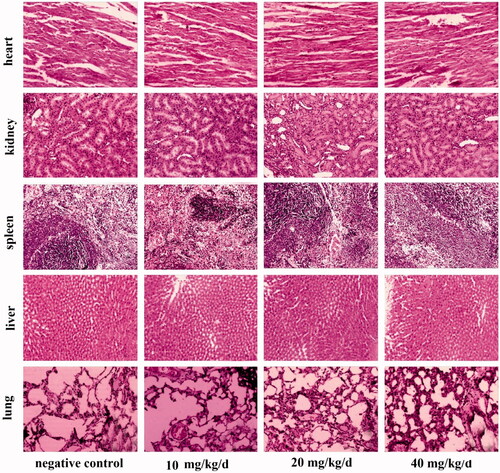
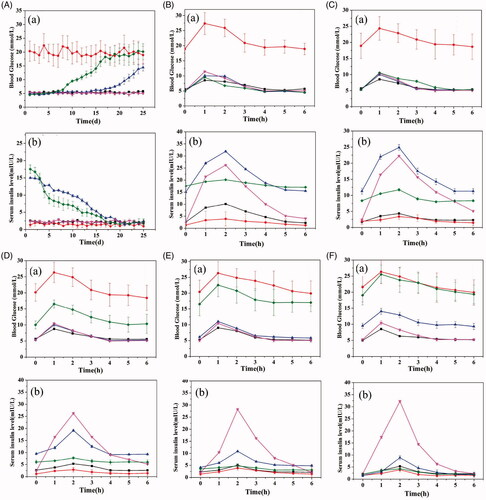
Figure 6. The in vivo efficacy of the multilayer microspheres in a murine model of type II diabetes. The characteristic of glucose concentration and serum insulin, showing (a) glucose concentration and (b) serum insulin levels over (A) 21 days and more detailed profiles during the 6 h period after gavage on days (B) 1, (C) 6, (D) 11, (E) 16 and (F) 21. Symbols for groups are as follows: ▪ negative control; • positive control; ▴ multilayer microspheres; ▿ insulin injection; and, ♦ porous PLGA microspheres.