Figures & data
Figure 1. (A) Synthetic route of DTX-S-S-OA; (B) Preparation of prodrug NPs of DTX-S-S-OA; (C) Particle size of DTX-OA/DSPE2K NPs; (D) Particle size of DTX-S-S-OA/DSPE2K NPs; (E) Morphology of DTX-OA/DSPE2K NPs and DTX-S-S-OA/DSPE2K NPs by TEM; (F) MD simulations of tetramers of prodrugs.
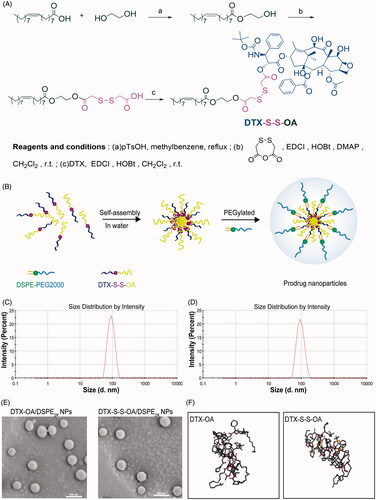
Figure 2. (A) Cumulative release of DTX from prodrug NPs in pH 7.4 with various concentrations of DTT (n = 3); (B) Schematic illustration of redox-responsive drug release of DTX-S-S-OA/DSPE2K NPs within tumor cells.
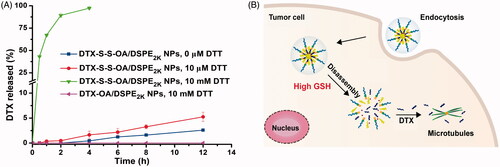
Figure 3. Cell viability treated with various concentrations of DTX solution, DTX-OA/DSPE2K NPs and DTX-S-S-OA/DSPE2K NPs after 48 h (A) or 72 h (B), respectively.
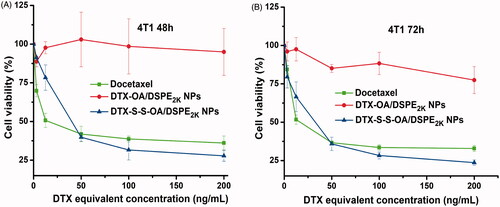
Figure 4. Confocal laser scanning microscopy (CLSM) images of 4T1 cells incubated with C-6solution or C-6labeled prodrug NPs for 0.5 h or 2 h, respectively (A,B); (C) Quantitative analysis for the fluorescent intensity of confocal laser scanning microscopy (*p < .05 and **p < .01, n = 3); (D) Flow cytometry results of cellular uptake of 4T1 cells after incubation for 2 h with (Blank control, C-6 solution, DTX-OA/DSPE2K NPs and DTX-S-S-OA/DSPE2K NPs); Cellular uptake results of pretreating 4T1 cells with several endocytosis inhibitors after incubation with DTX-OA/DSPE2K NPs (E) or DTX-S-S-OA/DSPE2K NPs (F) (*p < .05, **p < .01 and ***p < .001 vs. control group, n = 3).
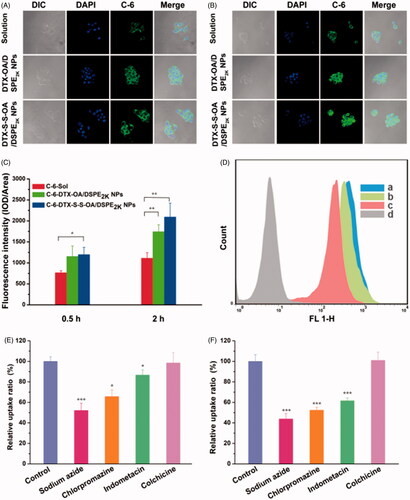
Figure 5. (A) Plasma concentration-time profiles of DTX solution, prodrug nanoassemblies after a single intravenous administration of 5 mg/kg (DTX equivalent) (n = 6); (B) In vivo fluorescent distribution images of DiR solution and DiR-labeled prodrug nanoassemblies at 24 h.
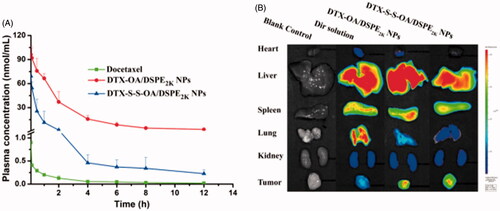
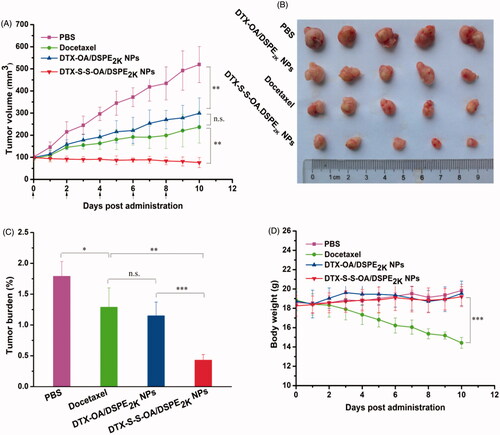
Figure 6. Evaluation on the in vivo antitumor activity against 4T1 xenograft tumors. (A) The changes of the tumor volume after various treatments; (B) Images of tumors after the last treatment; (C) Tumor burden after the last treatment, tumor burden = tumor weight/average body weight; (D) Body weight variations during treatment (*p < .05, **p < .01 and ***p < .001, n = 5).