Figures & data
Table 1. Composition of the nanoemulsion formulations.
Figure 2. Profiles of (a) average droplet size and (b) polydispersity index of L1 to L5, (c) size distribution and (d) TEM image of L3, ESEM images of (e) first (L3), (f) second (L7) and (g) third (L9) generation nanoemulsions (magnification factor: 16,000 ×).
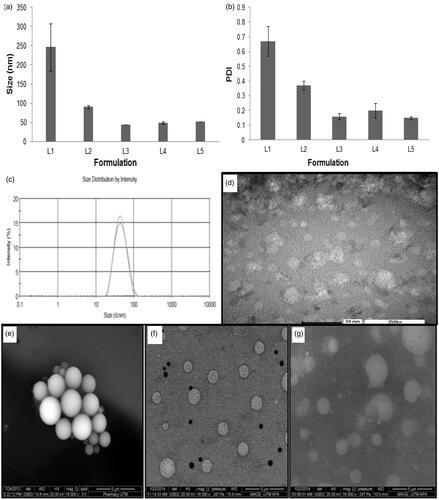
Table 2. Physicochemical characteristics of nanoemulsions with reference to (a) average droplet size, PDI and zeta potential, and (b) pH, surface tension, density, specific viscosity, refractive index, drug content, burst drug release extent and duration to complete drug dissolution.
Figure 3. (a) Cumulative percentage drug release profiles and (b) In vitro Anderson cascade impaction deposition of drug from first, second and third-generation nanoemulsions.
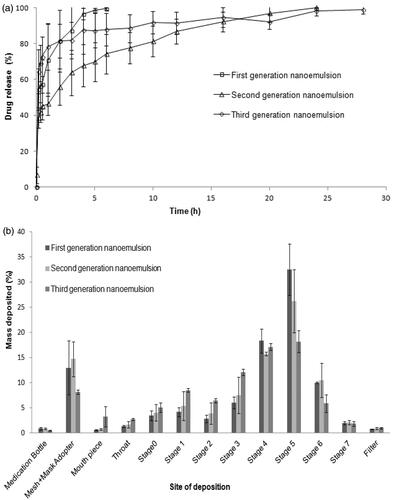
Table 3. Profiling of (a) aerosolization and inhalation performances of nanoemulsions determined using the Anderson cascade impaction and gravimetric methods, and (b) their relationship with the physicochemical properties of nanoemulsions.
Table 4. Aerosolization profiles of nanoemulsions determined by laser diffraction method.
Figure 4. Profiles of (a) average corrected cell fluorescence intensity within alveolar macrophages after treatment with second and third-generation nanoemulsions, (b) confocal laser scanning microscopic images showing endocytosis of second generation nanoemulsion (i–iii) and third-generation nanoemulsion (iv–vi) in macrophages where (i) and (iv) were fluorescent micrographs, (ii) and (v) were differential interference contrast images, (iii) and (vi) were merge images of fluorescent and differential interference contrast images, (c) average viability of alveolar macrophages following treatment with rifampicin solution and rifampicin loaded nanoemulsions.
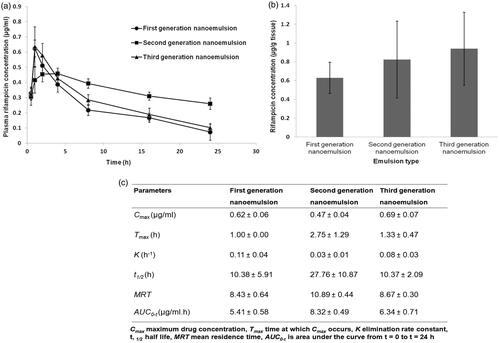
Figure 5. Profiles of (a) average plasma rifampicin concentration-time curves, (b) rifampicin concentrations in homogenized lung and (c) pharmacokinetics parameters obtained after intratracheal administration of rifampicin loaded nanoemulsions at dose of 2 mg/kg body weight.