
Figures & data
Table 1. Characterization of GKA-NSps prepared using different stabilizer and ratios of GKA/TPGS (mean ± SD, n = 3).
Figure 1. Preparation and characterization of GKA-NSps. (A) Particle size distribution and photograph of GKA-NSps; (B) TEM image of GKA-NSps; (C) XRD patterns of the GKA bulk powder, stabilizer (TPGS), GKA-NSps, and the physical mixture of GKA bulk powder and TPGS; (D) Differential scanning calorimetry thermograms of the GKA bulk powder, stabilizer (TPGS), GKA-NSps, and the physical mixture of GKA bulk powder and TPGS.
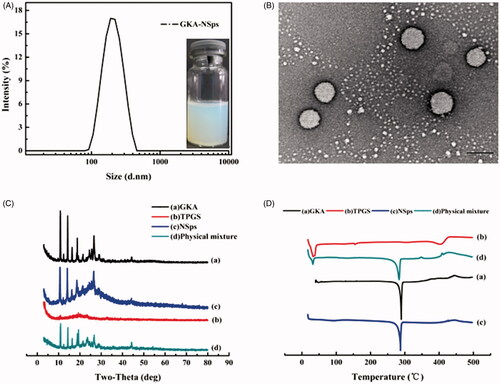
Figure 2. Stability and in vitro drug release profiles of GKA-NSps. (A) Size and PDI changes of the GKA-NSps after incubation with various physiological media at 37 °C for 12 h; (B) The in vitro drug release profiles of GKA-NSps and GKA coarse suspensions in pH 7.4 PBS containing 5% (w/v) BSA at 37 °C (mean ± SD, n = 3).
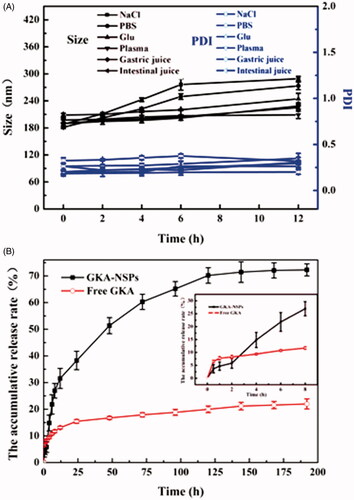
Figure 3. In vitro cytotoxicity studies and in vivo antitumor activity against MCF-7 tumor-bearing mice. (A) Cytotoxicity of GKA-NSps and GKA DMSO solution against MCF-7 cells (a) and normal HUVECs (b) after 48 h of incubation (mean ± SD, *p < .05, **p < .01); (B) (a) The growth of tumor volume with administration in each group; (b)The body weight change of mice over time (mean ± SD, n = 7, ↓represents administrating of drugs).
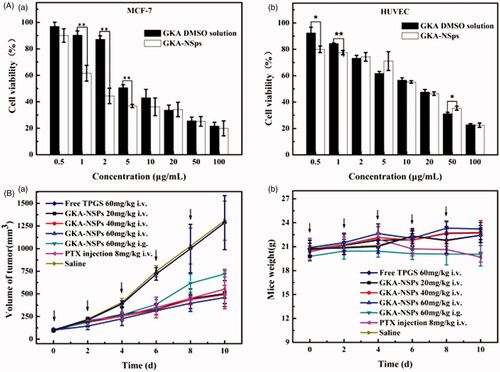
Table 2. IC50 values of GKA-NSps and GKA solution against different tumor cell lines and HUVECs after incubation for 48 h (mean ± SD).
Table 3. Inhibiting effect of GKA-NSps in the MCF-7 model (mean ± SD, n = 7).