Figures & data
Figure 1. (A) The chemical structure of brusatol. (B) Appearance of BR-SMEDDS under different conditions: 1. Appearance of BR-SMEDDS at room temperature; 2. Appearance of BR-SMEDDS diluted 100-fold with distilled water; and 3. Appearance of BR-suspension. (C) Particle size and distribution of BR-SMEDDS. (D) Zeta potential of BR-SMEDDS. (E) TEM image of droplet BR-SMEDDS. (F) Plasma concentration-time profiles of rats after oral administration with BR-SMEDDS and BR-suspension. Data are expressed as mean ± SD (n = 6). *p < .05 and **p < .01 versus suspension group.
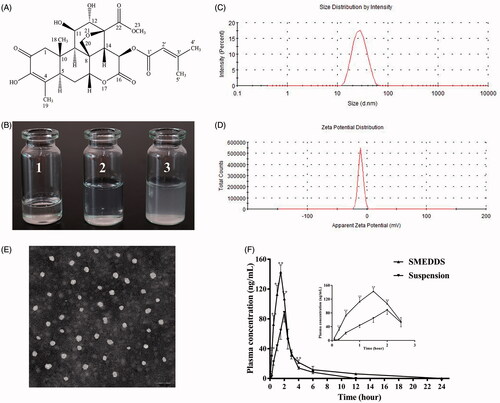
Table 1. Effects of different pH mediums on the stability of BR-SMEDDS.
Table 2. Pharmacokinetics parameters of BR-SMEDDS and BR-suspension after oral administration in rats.
Figure 2. General performance of DSS-induced colitis in mice. (A) Weight loss score. (B) Stool consistency score. (C) Bleeding score. (D) Disease activity index. (E) Macroscopic appearances of colon tissues and (F) The lengths of colons. Mice receiving distilled water served as control. Data are presented as mean ± SD of 10 mice in each group. #p < .05 and ##p < .01 versus control group, *p < .05 and **p < .01 versus DSS group, △ p < .05 and △△ p < .01 versus BR-suspension group, ⋆ p < .05 and ⋆⋆ p < .01 versus SASP group, ★ p < .05 and ★★ p < .01 versus AZA group.
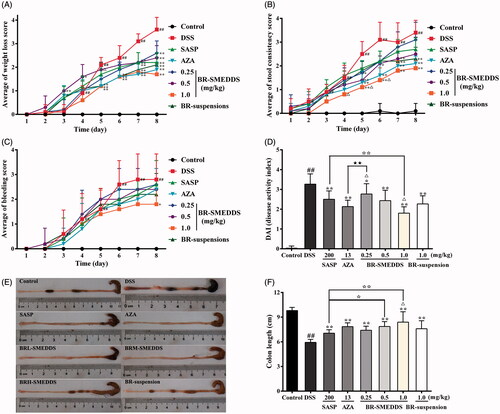
Figure 3. Histomorphological behavior and effects on the production of biochemical cytokines in colorectums. (A) Representative H&E staining slices from colorectal sections, original magnification 200×. (B) Histopathological scores. (C) TNF-α. (D) IFN-γ. (E) IL-1β. (F) IL-6. (G) IL-4. (H) IL-10. (I) PGE2. (J) MPO. (K) MDA. (L) GSH-Px. (M) SOD. Data are presented as mean ± SD of six mice in each group. #p < .05 and ##p < .01 versus control group, *p < .05 and **p < .01 versus DSS group, △ p < .05 and △△ p < .01 versus BR-suspension group.
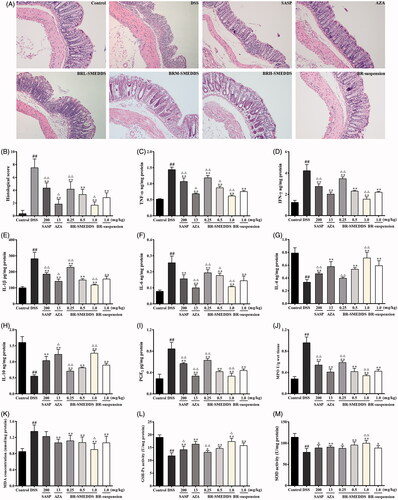
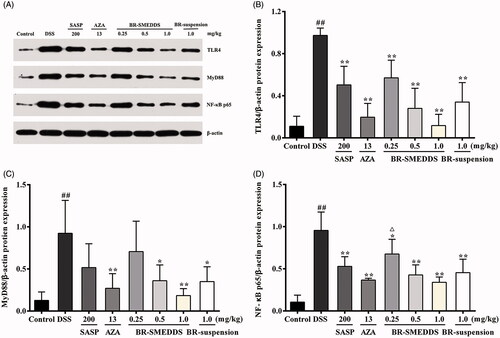
Figure 4. Effects on the protein expression of TLR4, MyD88 and NF-κB p65 in colorectums by Western blotting. (A) Representative Western blotting images of TLR4, MyD88 and NF-κB p65 protein expression in DSS-induced colonic tissues. (B) Changes in the expression level of TLR4 protein. (C) Changes in the expression level of MyD88 protein. (D) Changes in the expression level of NF-κB p65 protein. Data are presented as mean ± SD of three mice in each group. #p < .05 and ##p < .01 versus control group, *p < .05 and **p < .01 versus DSS group, △ p < .05 and △△ p < .01 versus BR-suspension group.