Figures & data
Figure 1. Physicochemical characterization of nanoparticles (A–D) and cytotoxicity study in vitro (E–G) (A): GEF-NPs particle size distribution; (B): Zeta Potential of GEF-NPs; (C): AFM image of GEF-NPs (scale bar =50 nm); (D): In vitro drug release of GEF-NPs and free GEF. Data are shown as means ± SD (n = 3). Cytotoxicity study in vitro: 24-h MTT and 48-h MTT was shown in Figure E and F, respectively. (G): The toxicity of PCEC to A549.
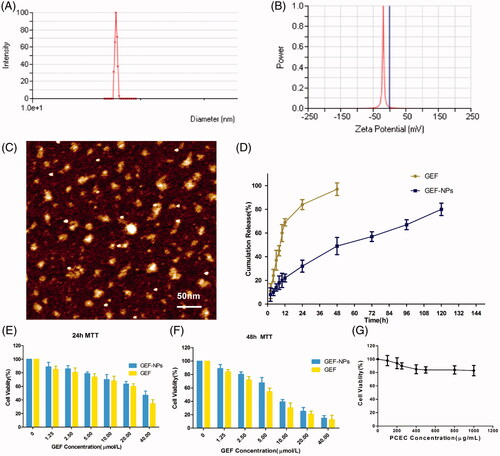
Table 1. Characteristics of GEF-NPs.
Figure 2. In vitro cellular uptake of PCEC polymeric micelles (A–C), example of each group mice on PET imaging (D–F) and evaluation of antitumor efficiency(G–I) A: blank control; B: The mixture of Coumarin-6 and PCEC; C:Coumarin-6-labeled PCEC nanoparticles (×400); (D):NS group, (E):GEF group, (F):GEF-NPs group; Evaluation of antitumor efficiency in vivo (G) and body weight changes (H) after treatment on A549 tumor-bearing nude BALB/c mice. Each point represents the mean of tumor size ± SD (6≤N ≤ 12). (I): The fraction survival of each group.
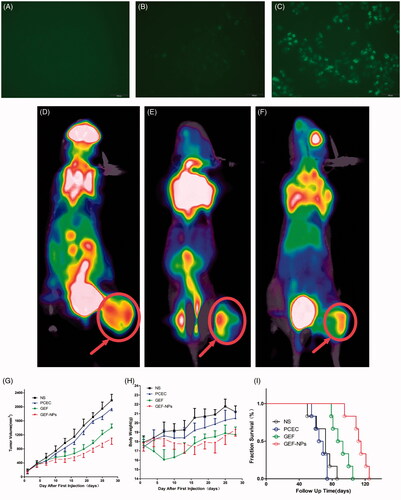
Figure 3. The tumor tissue apoptotic distribution (A–E) and cell-cycle distribution (F–J): (A–D): tumor tissue apoptotic distribution of different therapeutic effects on A549 tumor-bearing nude BALB/c mice; (E) Quantitative analysis of the proportion of cells in each group tumor tissue apoptotic distribution. (F–I): cell-cycle distribution of different therapeutic effects on A549 tumor-bearing nude BALB/c mice; (J): Quantitative analysis of the proportion of cells in each group cell-cycle distribution.
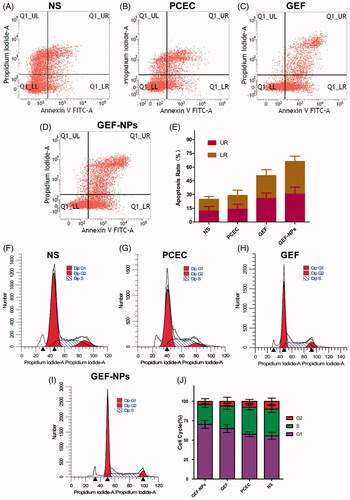
Figure 4. Side effects evaluation: H&E staining sections of skin and lung of each group (Original magnification, ×200): (A): The level of TGF-β1 in blood; (B): The content of HYP in lung tissue. (C): The level of IL-6 in blood. *p < .05 and **p < .01.
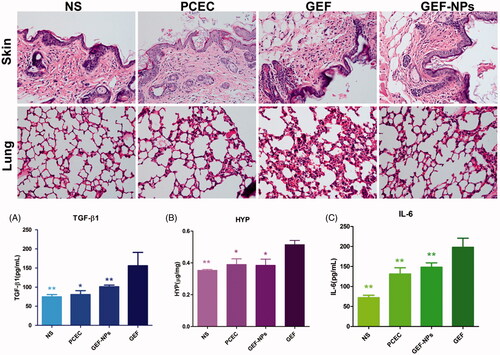
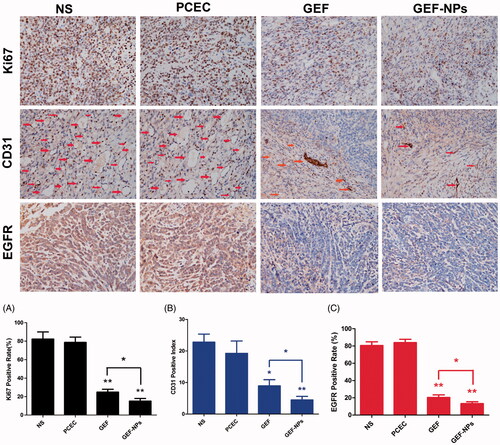
Figure 5. Representative images of immunohistochemistry analysis of each group for the evaluation of ki67, CD31 and EGFR. (Original magnification, ×400) The quantification immunohistochemistry analysis of each group for the evaluation of ki67, CD31 and EGFR were Figure A–C respectively. *p < .05 and **p < .01.