Figures & data
Scheme 1. The hydrolysis of topotecan (A) to produce carboxylate (B).
Scheme 2. The mechanism of CLN system to inhibit hydrolysis and improve intestinal lymphatic transport while oral administrating.
Figure 1. Size distribution of TPT-CLN (A) by DLS; TEM micrograph of TPT-CLN (B), the scale bar is 500 nm.
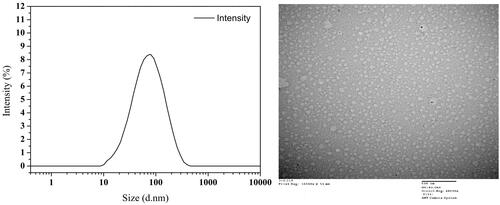
Figure 2. Results of in vitro stability at 37 °C using artificial intestinal juice as release medium (pH 6.5). Dotted line: TPT-CLN and free TPT were placed in artificial intestinal juice, the content of topotecan determined with the total of the topotecan (lactone plus carboxylate forms) as function of time; solid line: TPT-CLN and free TPT were placed in artificial intestinal juice, the content of topotecan determined with the lactone forms as function of time in artificial intestinal juice (pH 6.5). Topotecan was measured using HPLC, date point represent the mean ± SD (n = 3).
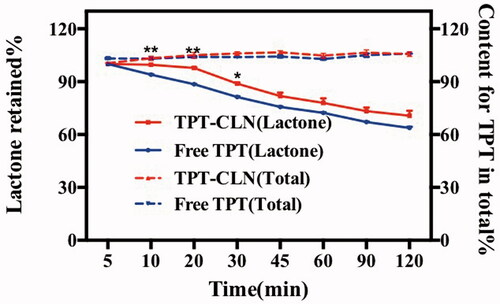
Figure 3. Plasma concentration versus time profiles of topotecan after oral administration of TPT-CLN or free topotecan to rats pretreated with saline (A), pretreated with 3 mg/kg cycloheximide (B) (n = 6 and 5 mg/kg).
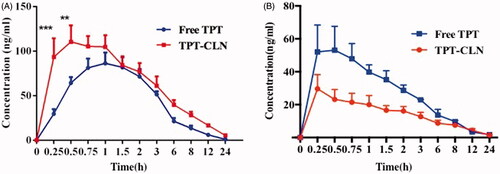
Table 1. Pharmacokinetic parameters evaluated with topotecan concentration in rats after oral administration of two formulations pretreated with saline at a dose of 5 mg/kg.
Figure 4. The results of in vivo antitumor activity studies. Tumor xenografts from HepG2 cancer cells were established subcutaneously in athymic nude mice and were treated with saline (control), TPT-CLN (500 mg/kg body weight) or free topotecan via the p.o. route for 5 consecutive days. (A) Tumor volume was measured on the 16 consecutive days, with the mean tumor volume. Data was reported as mean ± SD (n = 6) (*p < .05 between the free topotecan and TPT-CLN groups). (B) Measurement of tumor weight at the end of the study. (C) Photographs of excised tumor masses at the time of euthanasia on day 16 after treatment in HepG2 cancer cell xenograft-bearing mice. (D) Results of relative change rate of body weight. Data are shown as mean ± SD (n = 6), *p < .05, ***p < .001, Free TPT versus TPT-CLN.
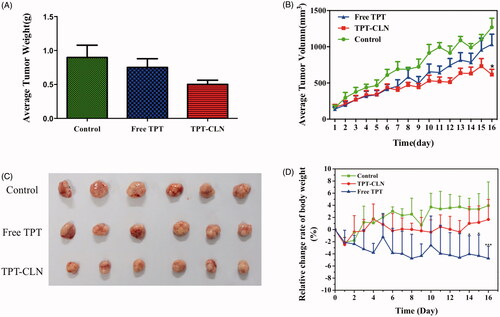
Figure 5. Confocal microscopy images of tumor cells from liver tumor model (nude mice) administrated with saline, free topotecan or TPT-CLN (n = 6, data not shown). Scale bars correspond to 200 μm.
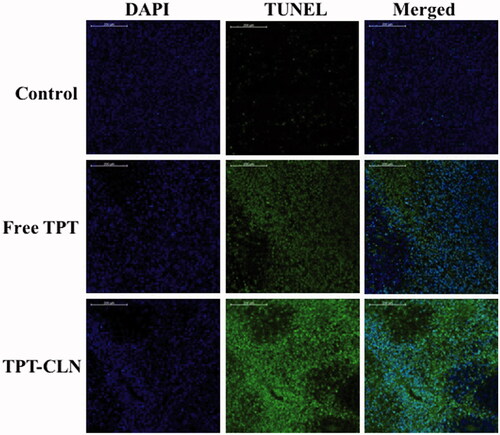
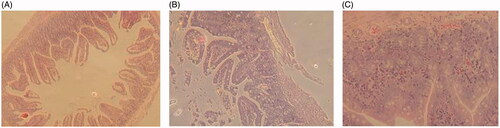
Figure 6. Results of gastrointestinal damage studies: light micrographs of sections of jejunum from mice treated with different treatments (n = 6, data not shown). (A) From a mouse in the control group that treated only with the saline. (B) From a mouse that treated with orally administration of free topotecan (5 mg/kg) for a single dose. (C) From a mouse that administrated orally with TPT-CLN at a single dose of 5 mg/kg.