Figures & data
Figure 1. Characterization of glycolipid-like copolymer micelles. (A) 1HNMR spectra of CSO, PEG2000, Ap, CSSA and Ap-CSSA in D2O. (B) TEM images of blank vehicles and DOX-loaded nanoparticles (Scale bar =50 nm). (C) The pyrene fluorescence intensity ratio of I1/I3 as a function of the logarithmic concentration (−Log C) of CSSA and Ap-CSSA copolymer micelles. (D) In vitro DOX release behaviors of CSSA/DOX and Ap-CSSA/DOX nanoparticles in PBS of pH 7.4 and pH 6.5 (n = 3). (E) DOX, CSSA/DOX nanoparticles and Ap-CSSA/DOX nanoparticles against U87 MG with a concentration of 0–10 μg DOX-equiv./mL for 48 h. (n = 5).
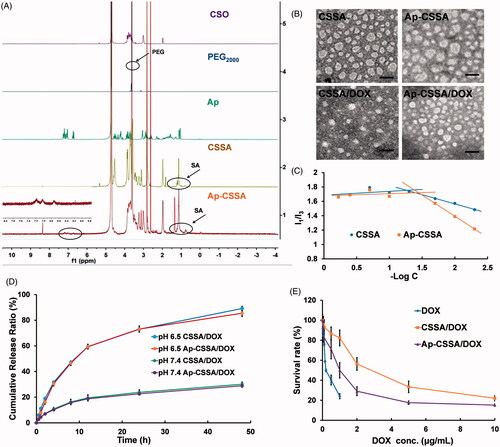
Figure 2. Cellular targeting uptake. (A) Intracellular fluorescence distribution in bEnd.3 cells and U87 MG cells after incubated with FITC-labeled CSSA and Ap-CSSA copolymer micelles for 1 h and 4 h. The nuclei were stained with DAPI (blue) (Scale bar =20 μm). Mean fluorescence intensity of FITC-labeled vehicles uptake in bEnd.3 cells (B) and U87 MG cells (C) measured by flow cytometer (n = 3). (D) In vitro colocalization of CSSA/DOX nanoparticles, Ap-CSSA/DOX nanoparticles with LRP1 in bEnd.3 cells and U87 MG cells. The white arrows show co-localized (yellow) of DOX-loaded nanoparticles (red) and LRP1 receptors (green) (Scale bar =30 μm). (E) The effect of different endocytosis inhibitors on Ap-CSSA copolymer micelles treated U87 MG cells (F) and relative fluorescence intensities revealing the extent of cellular uptake in each studied group. (G) Total fluorescence intensity of DOX·HCl, CSSA/DOX nanoparticles and Ap-CSSA/DOX nanoparticles on U87 MG tumor spheroid for 1 h at certain depths.
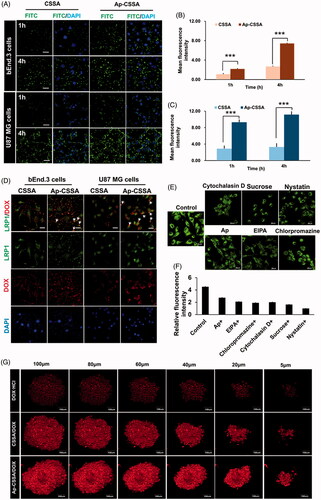
Figure 3. BBB pathological leakage provided an effective pathway for Ap-CSSA/DOX nanoparticles crossing the barrier and GBM cascade-targeting in vitro. An in vitro physiological BBB model (A) and pathological BBB model (B). (C) Effect of VEGF/VEGFR signal pathway on claudin-5 expression in the bEnd.3 cells observed by confocal imaging (Scale bar =30 μm). (D) The fluorescence intensity of claudin-5 signal measured by Image J (n = 3). (E) Cascade-targeting capacity of CSSA/DOX and Ap-CSSA/DOX nanoparticles in U87 MG cells at pathological BBB model (Scale bar =30 μm). (F) The transport ratios of CSSA/DOX and Ap-CSSA/DOX nanoparticles across the physiological BBB mode and pathological BBB model in vitro over a period of 1 h, 4 h (n = 3).
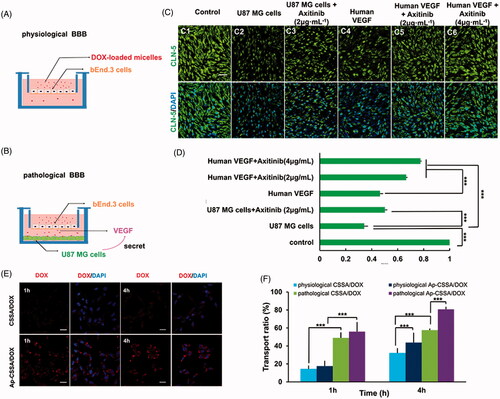
Figure 4. Disruption of TJs led to BBB breakdown, together with an increased bio-distribution of Ap-CSSA in vivo. (A) Confocal x–y–z scanning images of normal brain tissue section (A1–A4) and GBM-bearing brain (A5–A8), immune-stained for claudin-5 (red) and nuclear (blue) (Scale bar =50 μm). Ultrastructure of TJs in normal brain tissues (B, C), brain tumor (D, E) and the margin tissues of brain tumor (F, G) by TEM.
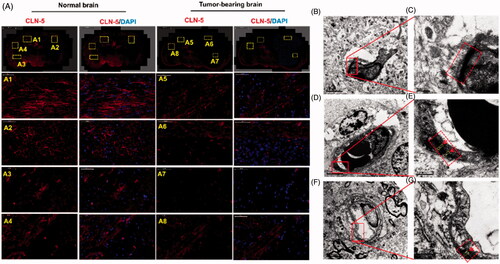
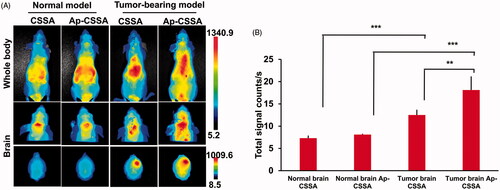
Figure 5. (A) In vivo biodistribution of CSSA/DiR, Ap-CSSA/DiR on normal and tumor-bearing nude mice after i.v injection and (B) the signal counts analysis (n = 3).
Scheme 1. Transport routes of Ap-CSSO/DOX nanoparticles crossing the BBB. (A) Normal BBB with integrated TJs. (B) TJs was completely broken in GBM tissues. (C) The margin between normal brain tissues and GBM, TJs was slightly disrupted.
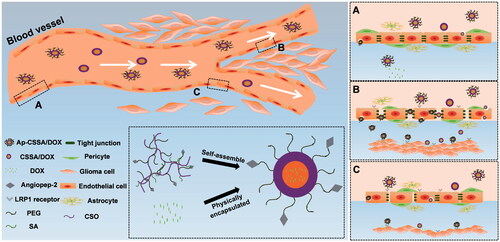
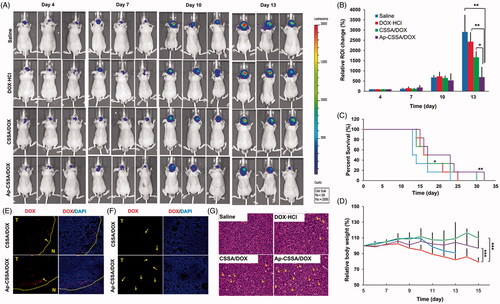
Figure 6. Antitumor activity. (A) In vivo bioluminescence imaging of U87-luci bearing nude mice at different time points after treatment (day 4, 7, 10, 13). (B) Quantitative of signals from the entire abdominal region of each mouse (n = 3). (C) Kaplan–Meier survival curves (n = 6). (D) Body weight changes exposed to various treatment (n = 6). In vivo distribution of DOX-loaded nanoparticles in the margin (E) and center areas (F) of the orthotopic brain tumor. (G) H and E staining of brain tumor sections and heart sections after the i.v. injection with saline, DOX·HCl, CSSA/DOX and Ap-CSSA/DOX nanoparticles, respectively.