Figures & data
Figure 1. The mean diameter, ξ-potential and morphology of PEI/dsRNA-p21 binary complexes and various HA-PEI/dsRNA-p21 ternary complexes. The particle size and ξ-potential were determined using dynamic light scattering (DLS); morphology was tested using transmission electron microscopy (TEM) analyzes. (A) Mean diameter and ξ-potential. HA-PEI/dsRNA-p21 ternary complexes had HA/PEI ratios of 1:1, 1:2, 1:4, 1:6 and 1:8. Error bars represent mean ± SD for n = 5. (B) Morphology of PEI/dsRNA-p21 binary complexes and HA-PEI/dsRNA-p21 ternary complexes at HA/PEI ratio of 6. Scale bar, 100 nm. (C) ξ-Potential distribution. (D) Size distributions.
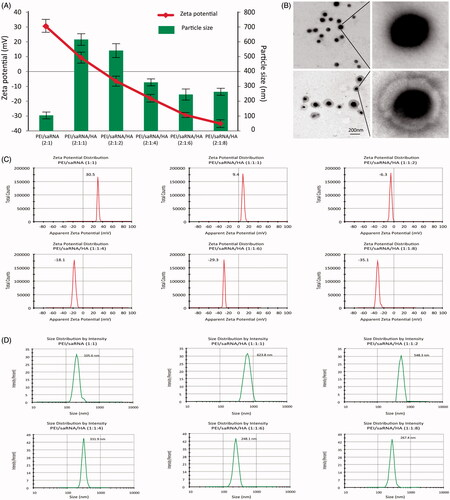
Figure 2. The gel retardation, cytotoxicity and stability assay of PEI/dsRNA-p21 binary complexes and various HA/PEI/dsRNA-p21 ternary complexes. (A) Condensation ability. (B) Protection capability against RNase. (C) The size of different complexes in physiological salt condition was determined by DLS. Error bars represent means ± SD for n = 5. (D) The effect of HA dosage on Lovo cell viability of different complexes were evaluated by MTT. (E) The effect of HA dosage on 293 T cell viability of different complexes were evaluated by MTT. Error bars represent means ± SD for n = 5. a represents PEI/dsRNA-p21 at weight ratio of 1:1; b represents HA/PEI/dsRNA-p21/at HA/PEI weight ratio of 1; c represents HA/PEI/dsRNA-p21/at HA/PEI weight ratio of 2; d represents HA/PEI/dsRNA-p21/at HA/PEI weight ratio of 4; e represents HA/PEI/dsRNA-p21/at HA/PEI weight ratio of 6, f represents HA/PEI/dsRNA-p21/at HA/PEI weight ratio of 8; and g represents HA/PEI/dsRNA-p21/at HA/PEI weight ratio of 10.
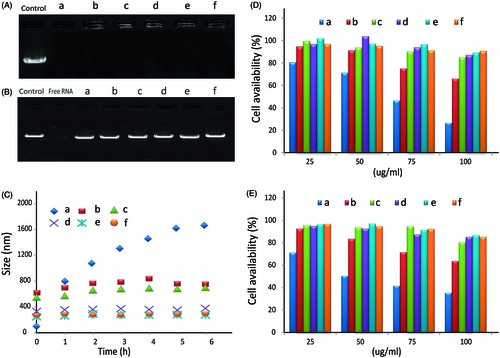
Figure 3. The Lovo and 293 T cell uptake efficiency after 6 h incubation with FITC-dsRNA-p21 or PE-dsRNA-p21 encapsulated systems. (A) Lovo cells were incubated with PE-dsRNA-p21 containing formulations at the dsRNA-p21 concentration of 50 nM for 6 h. (B) 293 T cells were incubated with FITC-dsRNA-p21 containing formulations at the dsRNA-p21 concentration of 50 nM for 6 h. In vitro cellular uptake was analyzed using CLSM. Blue DAPI dye stained the cell nucleus, the fluorescence of PE was red and the fluorescence of FITC was green. The multiple-exposure image of CLSM was acquired with filter (emission maximum 439 nm for DAPI, 680 nm for PE and 530 nm for FITC). (C) In vitro cellular uptake of Lovo cells was evaluated using flow cytometric analysis. (D) In vitro cellular uptake of 293 T cells was evaluated using flow cytometric analysis. (E) Mean intensity of fluorescence. Excitation was by a single 15 mW argon-ion laser beam (488 nm). Emission was collected through a 530 nm band for FITC and 680 nm for PE. a–g represents untreated, PEI/dsRNA-p21 at weight ratio of 1:1, HA/PEI/dsRNA-p21/at HA/PEI weight ratio of 1, HA/PEI/dsRNA-p21/at HA/PEI weight ratio of 2, HA/PEI/dsRNA-p21/at HA/PEI weight ratio of 4, HA/PEI/dsRNA-p21/at HA/PEI weight ratio of 6 and HA/PEI/dsRNA-p21/at HA/PEI weight ratio of 8 treated Lovo cells. a’-g’ represents untreated, PEI/dsRNA-p21 at weight ratio of 1:1, HA/PEI/dsRNA-p21/at HA/PEI weight ratio of 1, HA/PEI/dsRNA-p21/at HA/PEI weight ratio of 2, HA/PEI/dsRNA-p21/at HA/PEI weight ratio of 4, HA/PEI/dsRNA-p21/at HA/PEI weight ratio of 6 and HA/PEI/dsRNA-p21/at HA/PEI weight ratio of 8 treated 293 T cells. Error bars represent means ± SD for n = 3.
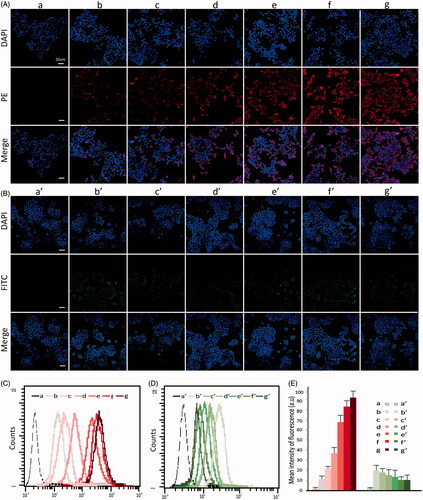
Figure 4. The in vitro pharmacological effect of different dsRNA-p21 containing formulations on Lovo cells. Lovo cells were transfected with 50 nM of the indicated dsRNA-p21 containing BC (c) and TC (d) for 48 h, untreated (a) and naked dsRNA-p21 (b) were used as control. (A) Induction of P21 protein expression was detected by Western blotting analysis. The results were normalized to b-actin as density ratio. (B) Colony formation analysis. (C) Activation of p21 by TC-dsRNA-p21 caused cell cycle arrest of Lovo cells at G1/G0. (D) Induction of p21 mRNA expression was analyzed by RT-PCR. The results were presented as means ± SD of three independent experiments and normalized to GAPDH. Expression levels were measured as fold relative to that of mock group. (E) Shown is the representative graph indicating cell distribution in the G1/G0, G2/M and S phases. (F) The TC-dsRNA-p21suppressed cell proliferation in Lovo colorectal cancer cells. Cell proliferation was determined by cell counting on a daily basis. Each time point data represents the mean ± standard deviation of six independent experiments. Cells of reference groups showed an exponential growth, whereas the growth of the cells with TC-dsRNA-p21 transfection was markedly suppressed. (**p < .01 and ***p < .005 compared to untreated group).
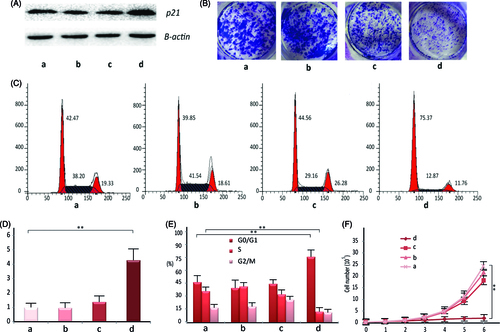
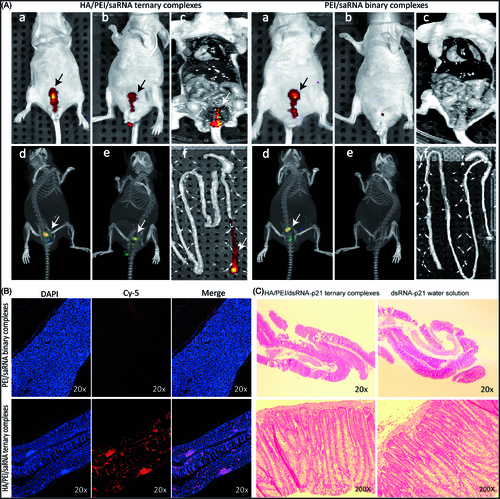
Figure 5. Bio-distribution and rectal irritation assay. The cy5-dsRNA-p21 entrapped TC ternary was administered into BALB/c mice via rectal injection. The cy5-dsRNA-p21 water solution was used as control. About 5 min and 3 h after treatment, fluorescent signals were collected using IVIS Spectrum Imaging System. 10 h later, mice were sacrificed and the colorectal tissue was carefully collected for frozen section and counter-stained with DAPI as well as HE stain. (A–a) and (A–d). Represent 2 D and 3 D fluorescent imaging, respectively 5 min after treatment. (A–b) and (A–e). Represent 2 D and 3 D fluorescent imaging, respectively 3 h after treatment. (A–c). Represent 2 D fluorescent imaging of postmortem. (A–f). Represent fluorescent imaging of colorectal tissue. (B) Samples were visualized by fluorescent microscopy. Representative images are cy5-p21-saRNA-322 uptake (red) and nuclear staining (DAPI, blue) in colorectal wall. (C) The morphology of rectal tissues after exposure to TC-dsRNA-p21 and dsRNA-p21 water solution.