Figures & data
Figure 1. Serum IgG antibody titers following intranasal administration of N-2-HACC-CMC/NDV-IBV NPs, N-2-HACC-CMC/NDV/IBV NPs, commercially combined attenuated live vaccine, N-2-HACC-CMC NPs and PBS. (A) Titers of serum anti-NDV IgG; (B) Titers of serum anti-IBV IgG. Values represent mean ± SD (n = 3). *p < .05 and **p < .01 indicate statistically significant differences when compared to commercially combined attenuated live vaccine.
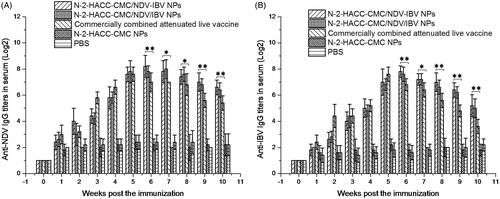
Figure 2. Titers of IgA antibody in tracheal fluid and Harderian gland of SPF chickens nasally immunized with the N-2-HACC-CMC/NDV-IBV NPs, N-2-HACC-CMC/NDV/IBV NPs, commercially combined attenuated live vaccine, N-2-HACC-CMC NPs, and PBS. (A) Content of anti-NDV IgA in Harderian gland; (B) Content of anti-NDV IgA in tracheal fluid; (C) Content of anti-IBV IgA in Harderian gland; (D) Content of anti-IBV IgA in tracheal fluid. The contents of IgA antibody in these samples were detected with ELISA. Values represent mean ± SD (n = 3). *p < .05 and **p < .01 indicate statistically significant differences when compared to commercially combined attenuated live vaccine.
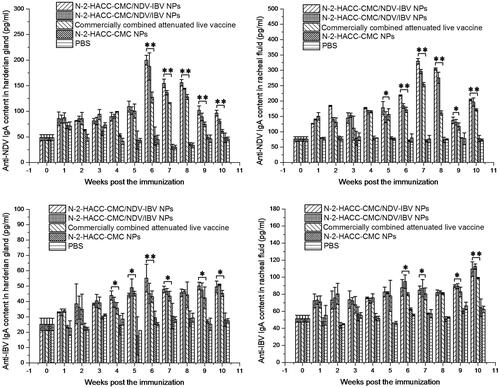
Figure 3. Analysis of proliferation of lymphocytes in the SPF chickens nasally immunized with the N-2-HACC-CMC/NDV-IBV NPs, N-2-HACC-CMC/NDV/IBV NPs, commercially combined attenuated live vaccine, N-2-HACC-CMC NPs, and PBS. Values represent mean ± SD (n = 3). *p < .05 and **p < .01 indicate statistically significant differences when compared to commercially combined attenuated live vaccine.
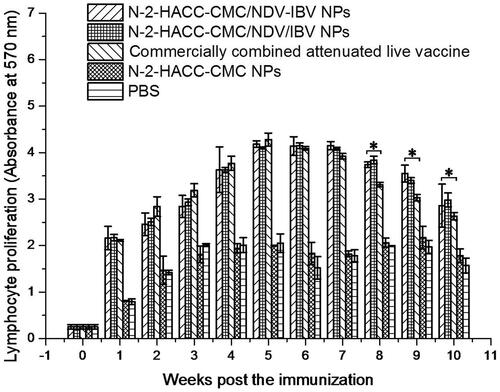
Figure 4. Levels of IFN-γ (A), IL-2 (B), and IL-4 (C) in the supernatant of splenocytes harvested from the SPF chickens nasally immunized with the N-2-HACC-CMC/NDV-IBV NPs, N-2-HACC-CMC/NDV/IBV NPs, commercially combined attenuated live vaccine, N-2-HACC-CMC NPs, and PBS. The levels of IFN-γ, IL-2 and IL-4 in the supernatant were analyzed in an enzyme-linked immunosorbent assay for chicken IFN-γ, IL-2 and IL-4. Values represent mean ± SD (n = 3). *p < .05 and **p < .01 indicate statistically significant differences when compared to commercially combined attenuated live vaccine.
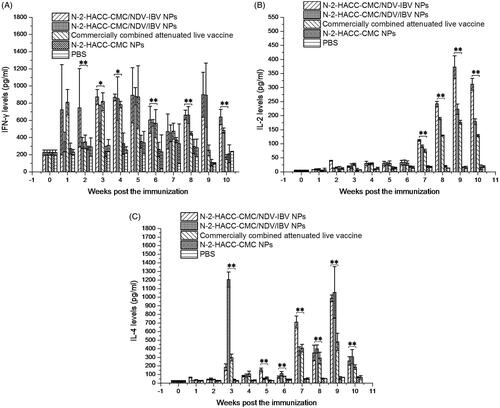
Figure 5. Titers of anti-NDV IgG (A) and titers of anti-IBV IgG (B) in serum of the immunized SPF chickens after being challenged with the highly virulent NDV strain F48E9 and IBV strain M41. Values represent mean ± SD (n = 3). *p < .05 and **p < .01 indicate statistically significant differences when compared to commercially combined attenuated live vaccine.
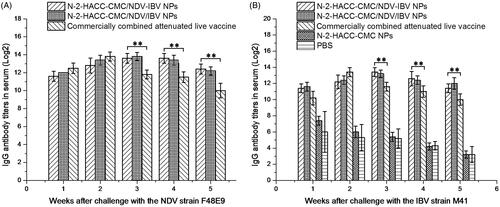
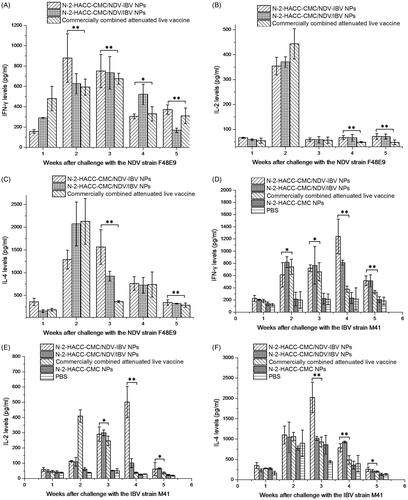
Figure 6. Levels of IFN-γ, IL-2, and IL-4 in the supernatant of splenocytes harvested from the immunized SPF chickens after being challenged with the highly virulent NDV strain F48E9 and IBV strain M41. A, B and C represent the levels of IFN-γ, IL-2, and IL-4 after being challenged with the NDV strain F48E9, respectively; D, E, and F represent levels of IFN-γ, IL-2, and IL-4 after being challenged with the IBV strain M41, respectively. The levels of IFN-γ, IL-2, and IL-4 in the supernatant were analyzed in an enzyme-linked immunosorbent assay for chicken IFN-γ, IL-2, and IL-4. Values represent mean ± SD (n = 3). *p < .05 and **p < .01 indicate statistically significant differences when compared to commercially combined attenuated live vaccine.