
Figures & data
Figure 1. (A) Synthesis of NAPG; (B) 1H-NMR spectrum of NAC, S100, and NAPG in D2O at 25 °C; (C) schematic illustration of Cur-NAPG-NLC for oral delivery of Cur by the formation of disulfide bond between NAPG with cysteine in mucus layer and PEG coating.
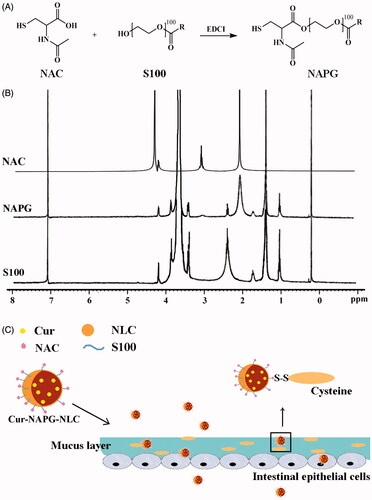
Figure 2. The TEM images of (A ) Cur-NLC and (B) Cur-NAPG50-NLC; (C) Power X-ray diffraction patterns of: Cholesterol oleate (a), Cur (b), physical mixture of Cur and NAPG50-NLC (c), blank NAPG50-NLC (d) and Cur-NAPG50-NLC (e); (D) DSC curves of: Cur(a), NAPG (b), blank-NAPG50-NLC (c) and Cur-NAPG50-NLC (d).
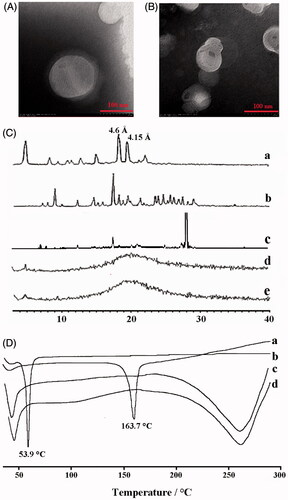
Table 1. Physicochemical properties of different NLC (mean ± SD, n = 3).
Figure 3. In vitro cumulative drug release profiles from Cur solution, Cur-loaded NLC and NAPG-NLC in (A) pH 1.2 hydrochloric acid solution for 2 h and in pH 6.8 PBS for next 22 h and (B) physiological saline containing 1% tween 80 at 37 °C (mean ± SD; n = 3).
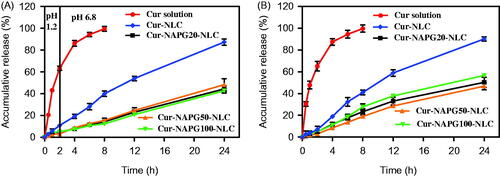
Figure 4. In situ single-pass perfusion, (A) Ka and (B) Peff of duodenum, jejunum and ileum. *p < .05 versus Cur solution, #p < .05 versus Cur-NLC (mean ± SD; n = 3). (C) Distribution of C6 labeled different NLC in duodenum, jejunum, and ileum after oral gavage to mice by CLSM. (D) Plasma concentration–time profiles of Cur in rats after gavage administration of Cur solution, Cur-NLC, and different Cur-NAPG-NLC at a dose of 50 mg/kg of Cur, and intravenous injection of Cur solution at a dose of 2 mg/kg of Cur. Data were presented as the mean ± SD (n = 6).
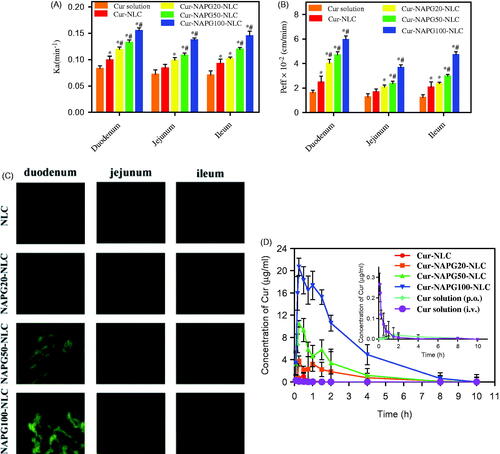
Table 2. Pharmacokinetics parameters of Cur after gavage administration of Cur solution, Cur-loaded NLC and NAPG-NLC at a dose of 50 mg/kg of Cur and intravenous injection of Cur solution at a dose of 2 mg/kg of Cur in rats (mean ± SD; n = 6).