Figures & data
Figure 1. Characterization of powder-laden MNPs. (A) Microneedle patch with a 6 × 9 array. (B) Microneedles labeled with FITC and loaded with SRB powder were observed under a confocal microscope (10×). Scale bar, 100 μm.
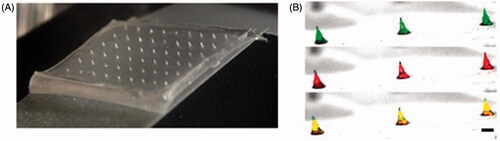
Figure 2. Determination of drug loading capacity. (A) Standard curve of absorbances at 260 nm vs. varying amounts of BCG-PSN powder dilutions. (B) The amount of BCG-PSN powder within an MNP was evaluated based on the standard curve shown in A. Each symbol represents the amount of BCG-PSN in nine microneedles cut from each patch, and the horizontal lines indicate the means of 6 patches with a 95% CI (confidence interval). The results of three independent experiments, designated 1, 2, and 3, are shown. In total, six MNPs and nine microneedles were used in each experiment.
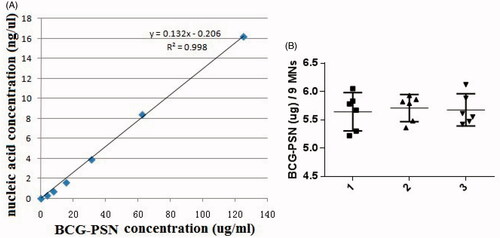
Figure 3. IFN-γ and TNF-α production in peripheral blood CD4 + T cells following BCG-PSN treatment. The data are representative of two independent studies with similar results and expressed as the mean ± SEM (n = 6 for each experiment). *p < .05 and **p < .01.
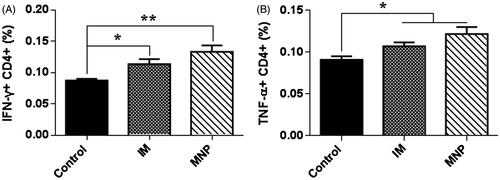
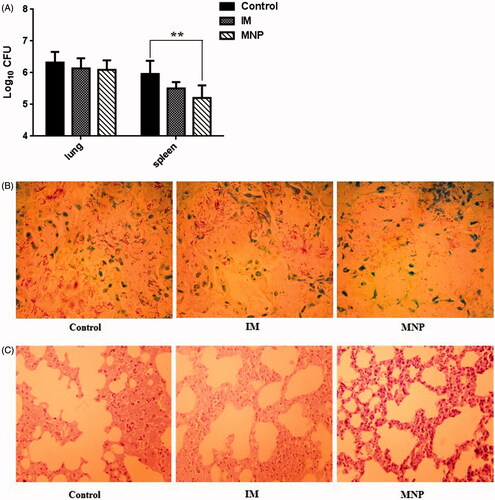
Figure 4. Evaluation of immunotherapeutic effects in vivo. (A) Determination of CFUs from the lungs and spleens of infected mice from each group. Colony counts were determined after four-week incubation at 37 °C and are represented as the log CFU value. Data are presented as the mean ± SEM (n = 6 for each experiment). **p < .01. (B) Acid-fast staining of mouse lung biopsy specimens (1000×). (C) Histopathological examination of mouse lung biopsy specimens (HE, 40×).