Figures & data
Figure 1. Characterization of Rg3-loaded Pluronic F127 micelles (P-Rg3) and the plasma concentration–time as well as survival profile curve. (A) Rg3 had poor water solubility and its solution was turbid, while P-Rg3 had high water solubility and its solution was clear and transparent. (B) Transmission electron microscopy (TEM) image showed the morphology of P-Rg3. (C) Size distribution of P-Rg3 was detected by dynamic light scattering (DLS). (D) Release profiles of P-Rg3 in PBS (PH 7.4) medium (n = 3). (E) The mean plasma concentration–time curve of Rg3 and P-Rg3 after oral administration for more than 48 h (n = 6). (F) Survival curves of each group (n = 10 for the control group and n = 30 for the other groups).
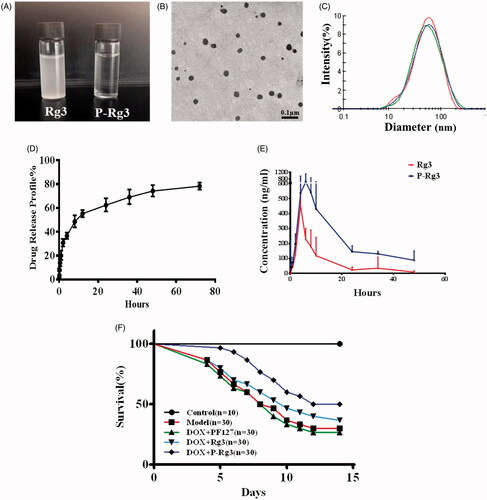
Figure 2. P-Rg3 ameliorated cardiac dysfunction induced by DOX. (A) Representative M-mode echocardiograms of mice in each group. (B–F) Left ventricular ejection fraction (EF %), fractional shortening (FS %), aortic valve peak velocity (Peak Vel), ratio of E-wave to E′-wave (E/E′), and Tei index = (IVCT + IVRT)/MVET were assessed by serial echocardiography in mice in each group; data are expressed as mean ± SD from 10 animals. **p < .01 vs. control group; #p < .05, ##p < .01 vs. DOX group; &p < .05 vs. Rg3 group. (G–I) The levels of lactate dehydrogenase (LDH), CK, and CK isoenzyme-MB (CK-MB) in mouse serum in each group, determined using an automatic biochemical analyzer (n = 10 per group). **p < .01 vs. control group, ##p < .01 vs. DOX group; &p < .05, &&p < .01 vs. Rg3 group. (J, K) ELISA results for ANP and BNP (n = 10 per group), **p < .01 vs. control group; #p < .05, ##p < .01 vs. DOX group; &p < .05 vs. Rg3 group. (L–P), Expression of systolic function-related genes (β-MHC, α-SKA, ANP, BNP, ANF) in adult cardiac myocytes from mice in each group. There was significant dysregulation of genes including classic markers of heart failure in the DOX group. This was improved by P-Rg3, resulting in ∼9-fold downregulation of β-MHC, ∼6-fold downregulation of α-SKA, ∼2-fold downregulation of ANP, ∼3-fold downregulation of BNP, and a ∼3-fold decrease in the expression of cardiac ANF. Data are presented as mean ± SD from three independent experiments. **p < .01 vs. control group; #p < .05, ##p < .01 vs. DOX group; &p < .05, &&p < .01 vs. Rg3 group.
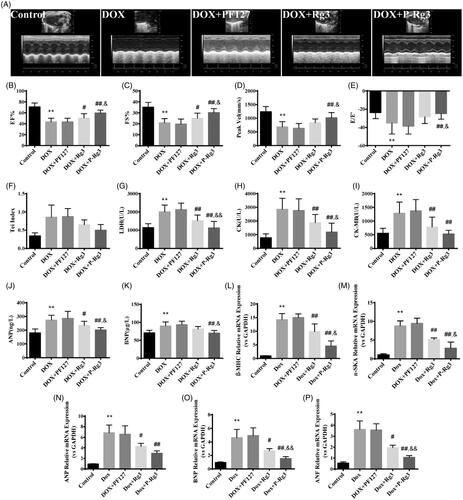
Figure 3. P-Rg3 prevented adverse remodeling and cardiac myocyte apoptosis induced by DOX. (A) Representative images showing gross cardiac morphology of mice in each group. (B) H&E staining of transverse sections. Scale bars, 50 μm. (C) TUNEL staining was performed on myocardial sections from mouse heart of each group. Apoptotic nuclei were visualized by green fluorescence. Nuclei were identified as blue [DAPI (4′, 6-diamidino-2-phenylindole)]. Scale bar, 25 μm. (D–G) Bar graphs showing quantitative data for body weight, heart weight, heart weight/shankbone length ratios (HW/SL), and lung weight/shankbone length ratios (LW/SL), n = 10. (H) and (I) Expression of apoptosis-related genes [Bcl-2-associated X protein (Bax) and Bcl-2] in adult cardiac myocytes from mice in each group. Data are presented as mean ± SD from three independent experiments. (J) Representative Western immunoblots for caspase 3 and caspase 9. (K) and (L), Bar graph showing corresponding quantitative data of caspase 3 and caspase 9. Data are presented as mean ± SD from three independent experiments. *p < .05, **p < .01 compared with the control group; #p < .05, ##p < .01 compared with the DOX group; &p < .05, &&p < .01 compared with the Rg3 group.
![Figure 3. P-Rg3 prevented adverse remodeling and cardiac myocyte apoptosis induced by DOX. (A) Representative images showing gross cardiac morphology of mice in each group. (B) H&E staining of transverse sections. Scale bars, 50 μm. (C) TUNEL staining was performed on myocardial sections from mouse heart of each group. Apoptotic nuclei were visualized by green fluorescence. Nuclei were identified as blue [DAPI (4′, 6-diamidino-2-phenylindole)]. Scale bar, 25 μm. (D–G) Bar graphs showing quantitative data for body weight, heart weight, heart weight/shankbone length ratios (HW/SL), and lung weight/shankbone length ratios (LW/SL), n = 10. (H) and (I) Expression of apoptosis-related genes [Bcl-2-associated X protein (Bax) and Bcl-2] in adult cardiac myocytes from mice in each group. Data are presented as mean ± SD from three independent experiments. (J) Representative Western immunoblots for caspase 3 and caspase 9. (K) and (L), Bar graph showing corresponding quantitative data of caspase 3 and caspase 9. Data are presented as mean ± SD from three independent experiments. *p < .05, **p < .01 compared with the control group; #p < .05, ##p < .01 compared with the DOX group; &p < .05, &&p < .01 compared with the Rg3 group.](/cms/asset/2f1ae6d4-4a53-46d3-a1d6-ae92f1682b34/idrd_a_1391893_f0003_c.jpg)
Figure 4. Assessment of mitochondrial function in mice of each group. (A) Ultrastructural analysis of mitochondrial integrity by transmission electron microscopy. Scale bar, top: 500 nm, bottom: 100 nm. (B) The ROS in myocardial mitochondria using DCFH-DA fluorescent probe detection kit. (C) Mitochondrial membrane potential (ΔΨm) measurement with the JC-1 probe. (D) Mitochondrial calcium overload (Ca2+) measurement with the vital dye calcein 4-AM. (E) Adenosine triphosphate (ATP) content, an indicator of mitochondrial function, was measured with ATP probe. n = 6, Data are presented as mean ± SD, **p < .01 compared with the control group; #p < .05, ##p < 0.01 compared with the DOX group; &p < .05, compared with the Rg3 group. (F, G) Oxygen consumption rate(OCR) in mitochondria isolated from the hearts of various groups was measured with a Seahorse metabolic analyzer, following the addition of the ADP, ATP coupler oligomycin, then the electron transport chain(ETC) accelerator FCCP, and then rotenone/antimycin A. ATP production levels and mitochondrial maximal respiration were then quantified. n = 3. Data are presented as mean ± SD, **p < .01 compared with the control group; ##p < .01 compared with the DOX group; &&p < .01 compared with the Rg3 group. (H) Representative Western immunoblots for oxidative phosphorylation (OXPHOS) complexes, ATP synthase delta 5 (ATP5D), and mitochondrial uncoupling protein 3 (UCP3). (I–K) Bar graph showing corresponding quantitative data for Western blotting. Data are presented as mean ± SD from three independent experiments, *p < .05, **p < .01 compared with the control group; #p < .05, ##p < .01 compared with the DOX group; &p < .05, &&p < .01 compared with the Rg3 group. (L) Total DNA from heart tissues of mice from each group was purified and subjected to quantitative PCR with specific primers for murine mitochondrial DNA (mtDNA). Data are presented as mean ± SD from three independent experiments, **p < .01 compared with the control group; ##p < .01 compared with the DOX group; &p < .05 compared with the Rg3 group.
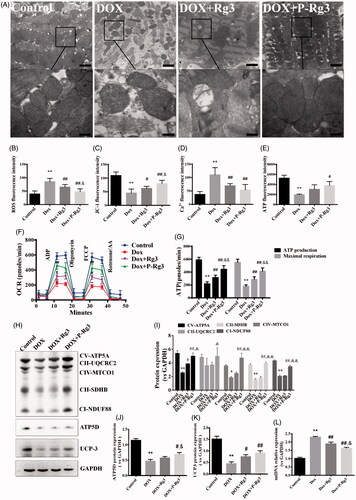
Figure 5. P-Rg3 prevented adverse cardiac myocyte apoptosis induced by DOX in vitro. (A) Representative images are of TUNEL staining of H9C2 cells from various groups; apoptotic nuclei are visualized as red fluorescence. Nuclei are identified as blue [DAPI (4′, 6-diamidino-2-phenylindole)]. Scale bar, 25 μm (n = 3 per group). (B) Cell viability of H9C2 cells was measured by MTT, n = 6. (C) Cell apoptosis was measured by caspase 3/7 probe, n = 6. Data are expressed as mean ± SD, **p < .01 compared with the control group; ##p < .01 compared with the DOX group; &p < .05, compared with the Rg3 group.
![Figure 5. P-Rg3 prevented adverse cardiac myocyte apoptosis induced by DOX in vitro. (A) Representative images are of TUNEL staining of H9C2 cells from various groups; apoptotic nuclei are visualized as red fluorescence. Nuclei are identified as blue [DAPI (4′, 6-diamidino-2-phenylindole)]. Scale bar, 25 μm (n = 3 per group). (B) Cell viability of H9C2 cells was measured by MTT, n = 6. (C) Cell apoptosis was measured by caspase 3/7 probe, n = 6. Data are expressed as mean ± SD, **p < .01 compared with the control group; ##p < .01 compared with the DOX group; &p < .05, compared with the Rg3 group.](/cms/asset/69917c28-1390-4158-911b-99cb78ccf363/idrd_a_1391893_f0005_c.jpg)
Figure 6. P-Rg3 inhibited mitochondrial dysfunction caused by DOX in H9C2 cells. (A) Ultrastructural analysis of H9C2 cells by transmission electron microscopy. Scale bar, 500 nm. (B) The ROS in H9C2 cells were tested using DCFH-DA fluorescent probe detection kit. (C) Mitochondrial calcium overload (Ca2+) was measured with the vital dye calcein-AM. D, Mitochondrial membrane potential (ΔΨm) was measured with the JC-1 probe. n = 6. Data are expressed as mean ± SD. **p < .01 compared with the control group; ##p < .01 compared with the DOX group; &&p < .01 compared with the Rg3 group. (E, F) OCR in H9C2 cells of various groups was measured with a Seahorse metabolic analyzer (details are provided in F). n = 3 for each group. (G) Representative Western immunoblots for OXPHOS complexes, Cyc-C, and UCP3. (H–J) Bar graph showing corresponding quantitative data. Data are presented as mean ± SD from three independent experiments, *p < .05, **p < .01 compared with the control group; #p < .05, ##p < .01 compared with the DOX group; &p < .05, &&p < .01 compared with the Rg3 group.
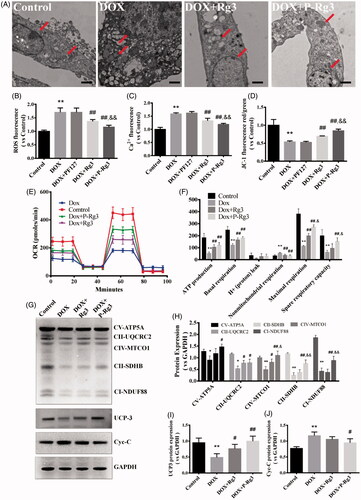
Figure 7. P-Rg3 increased the inhibitory effect of DOX in breast cancer. (A) Viability of 4T1β cells was measured by MTT, n = 6. (B) Cell apoptosis was measured by caspase 3/7 probe in 4T1β cells, n = 6. (C) Viability of MDA-MB-231 cells was measured by MTT, n = 6. (D) After treatment for 14 days, the tumor weight was examined in each group, n = 6. Data are expressed as mean ± SD, **p < .01 compared with the control group; #p < .05, ##p < .01 compared with the DOX group; &&p < .01 compared with the Rg3 group.
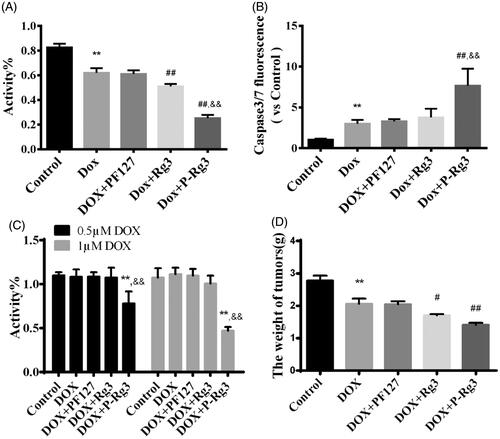
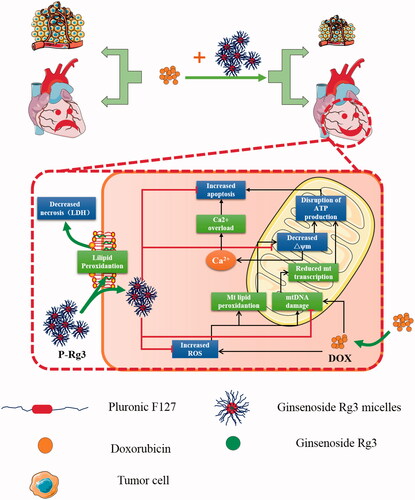
Figure 8. A schematic illustration showed that Ginsenoside Rg3 micelles mitigate doxorubicin-induced cardiotoxicity (DIC) and enhance its anticancer efficacy.