Figures & data
Table 1. Characterization of the biological and technological sets of solutions. Composition, pH, and osmolarity (mOsm/L).
Figure 1. APA microcapsules formulated with different types of osmolarity adjusting agents led to contrasting cell behavior in vitro. (A) Bright field and LIVE/DEAD fluorescence micrographs taken at different time points after cell encapsulation revealed diverging cell behavior. (B) Subsequent quantification of cell-aggregate areas demonstrated statistically significant differences. (C) Bromodeoxyuridine (BrdU) uptake studies confirmed these data by showing an important increase in proliferation in the technological group by day 30. Consequently, the biological biosystem presented a linear tendency for cell viability (D), metabolic activity (E), and erythropoietin (EPO) production (F), whereas technological capsules followed an exponential trend up to day 30. From that point on, this group withdrew from its tendency due to an increase in cell death. Line graphs symbolize mean ± SD (n = 5 for BrdU uptake, n = 3 for cell viability, and EPO production studies, n = 7 for metabolic assays). Statistical significance: *p < .05, **p < .01 and ***p < .001. Scale bars = 400 µm.
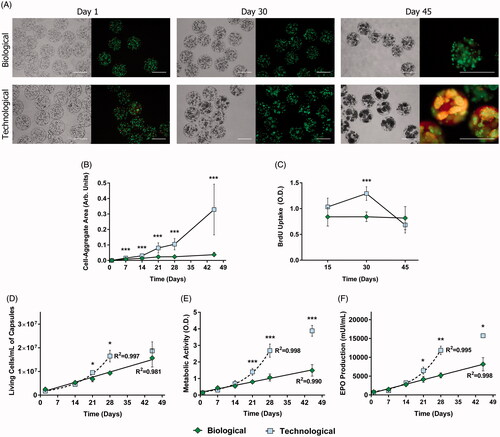
Figure 2. Mechanical studies revealed important differences in the structural properties of microcapsules. Diameter quantification of uncoated beads (A), alginate-poly-L-lysine-alginate (APA) microcapsules (B) and a comparison between biological and hybrid microcapsules (biological core and technological coatings) (C). In all cases, greater sizes were observed when employing technological solutions. Osmotic resistance was assessed for APA microcapsules (D) and a comparison between biological and hybrid microcapsules (E) and both showed an increased swelling behavior for the biological group. (F) Despite the three types of microcapsules presented a good resistance to rupture, it was enhanced in the hybrid and technological groups. (G) FITC labeled dextran diffusion showed no differences in permeability. (H) Calcium release assays proved a higher crosslinking degree in biological matrices. Graphs symbolize mean ± SD (n = 30 for diameter quantification and osmotic resistance, n = 3 for calcium determination assays, n = 4 for FITC dextran diffusion). Statistical significance: *p < .05, **p <.01, and ***p < .001.
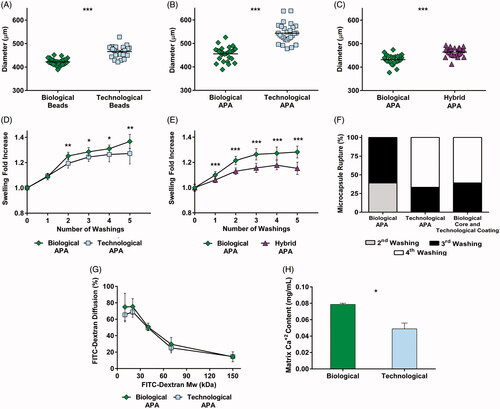
Figure 3. Cell cycle analysis demonstrated that the mechanical differences led to differing cell behavior in vitro. (A) Flow cytometry combining bromodeoxyuridine (BrdU) uptake and 7-aminoactinomycin D (7-AAD) staining showed no statistically significant differences at the very beginning of the study. (B) This tendency dramatically changed by day 30, where the proliferation rate of the technological group significantly increased. (C) Schematic representation of the results obtained in the combined flow cytometry assay at day 30. In particular, the scheme shows the proliferative capacity of the remaining cells that do not present a G0/1 state (44.7% biological, 42.1% technological). Graphs symbolize mean ± SD (n = 3). Statistical significance: *p < .05.
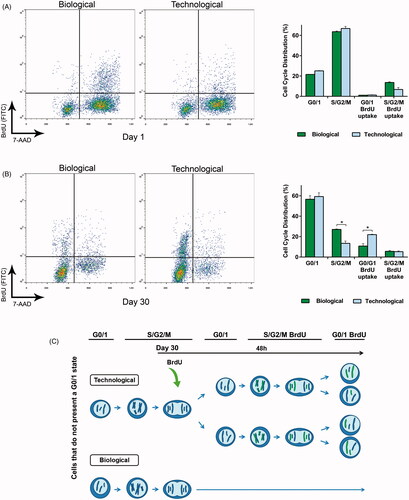
Figure 4. In vivo studies exhibited divergent therapeutic profiles. (A) Hematocrit levels increased progressively in a controlled fashion for all biological implants but showed an erratic trend with a big data dispersion for the technological group (B). (C) Morphological characterization after graft explantation revealed enormous cell-aggregates and broken capsules in the technological group. (D) Cell-aggregate area quantification proved statistically significant differences between the groups. (E) The histological studies showed empty microcapsules for the technological implants that failed (I). The analysis also confirmed that technological implants presented an intense inflammatory response (II), cell-aggregates causing microtumors (III), capsule rupture (IV), and the consequent extracapsular tumor formation (V). Such behavior was not observed in biological implants, where a lower inflammation (VI–VII) and capsule integrity with no cell extravasation (VIII–X) were observed. Graphs symbolize mean ± SD. (n = 5 for animal studies, n = 30 for diameter quantification). For the control group sole DPBS was administered. Statistical significance: (A) Between Control and Biological groups: **p < .01 and ***p < .001, between Control and Technological groups: ###p < .001; (D) ***p < .001. Scale bars: (C) = 400 µm; (E) I, II, VI, VII =400 µm; III, IV, V, VIII, IX =100 µm; X = 50 µm.
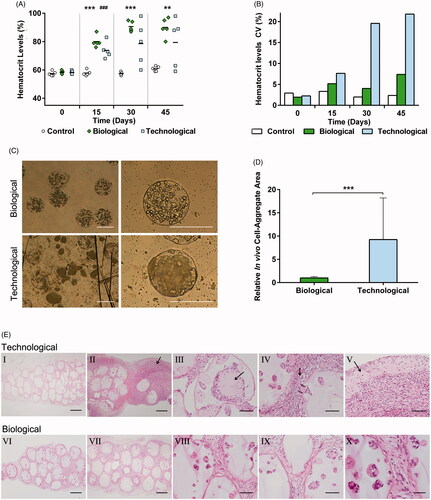
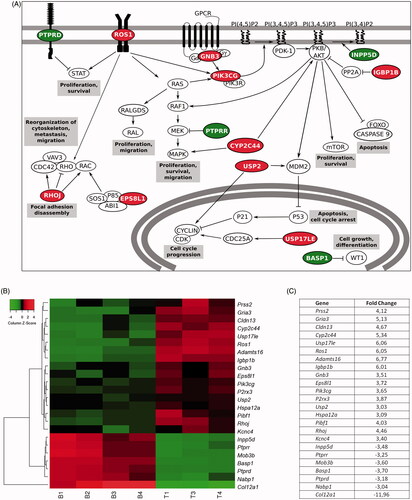
Figure 5. Gene expression studies proved that the behavioral differences were caused at a genic level. (A) Schematic representation of signaling pathways in which gene expression presents a fold change> 3 or< −3 in cells within technological microcapsules, in comparison to the biological group. (B) Heat map representation of differentially expressed genes. Results are expressed as a fold change ratio. Each column represents a replicate and each row represents a gene (Euclidean distance, average linkage; n = 4 for gene studies, with the loss of a technological replicate due to technical problems during hybridization process. B: biological; T: technological). (C) Values of fold change in cells within technological vs. biological capsules. In all cases, red color indicates up-regulated genes and green color down-regulated genes.