Figures & data
Figure 1. Schematic illustration for the preparation method of CLMSN/BIR.
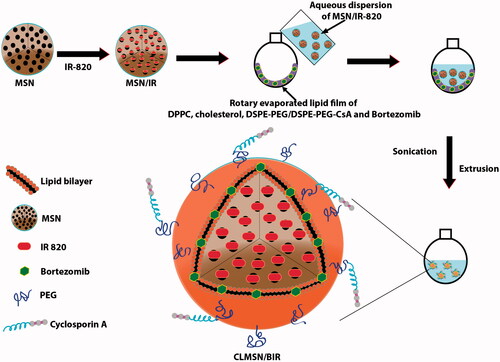
Figure 2. (A) Particle size, PDI, and zeta potential of blank and drug-loaded CLMSNs. (B) FTIR spectra for (1) blank MSN, (2) blank LMSN, (3) Bor, (4) IR-820, (5) LMSN/BIR, and (6) CLMSN/BIR. Stability of IR-820 in the (C) free- and (D) CLMSN-loaded forms under different temperature and light/dark conditions. Temperature elevations caused by IR-820 in (E) free- and (F) CLMSN-loaded forms at different concentrations following NIR irradiation (808 nm, 3.0 W/cm2) for up to 5 min.
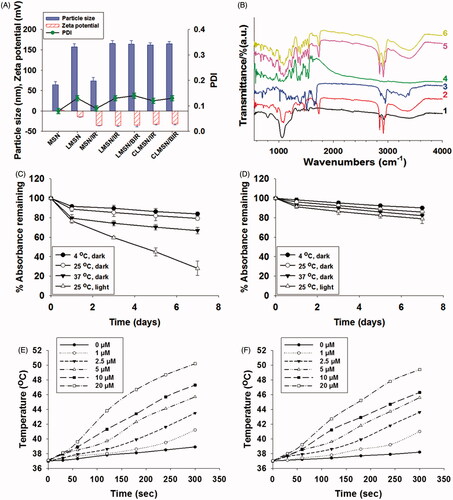
Figure 3. (A) TEM images of MSN, LMSN/BIR, and CLMSN/BIR. In vitro drug release profiles of Bor from CLMSN/BIR in (B) PBS and ABS and (C) with or without NIR irradiation (808 nm, 3.0 W/cm2). NIR irradiation was performed for 5 min with on/off cycles on alternating hours.
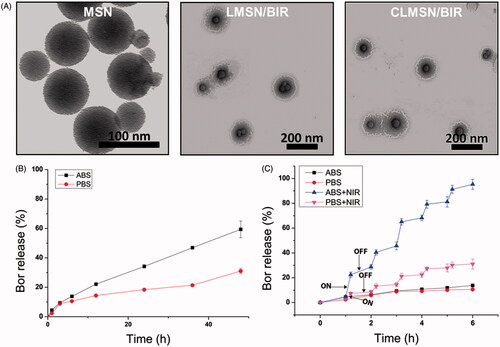
Figure 4. (A) Confocal images of the cellular uptake of coumarin-6-loaded LMSN and CLMSN in PANC-1 and MIA PaCa-2 cells (white arrows: non-lysosomal uptake, blue arrows: minimal lysosomal uptake; scale bar: 20 µm). (B) FACS analysis of the cellular uptake of coumarin-6-loaded LMSN and CLMSN in PANC-1 and MIA PaCa-2 cells. (C) In vitro cytotoxicity of Bor, IR-820, BIR, LMSN/BIR, and CLMSN/BIR in PANC-1 and MIA PaCa-2 cells after 24 h of treatment in the presence or absence of NIR irradiation (808 nm, 3.0 W/cm2, 5 min). Please check the online version of colored figures for details.
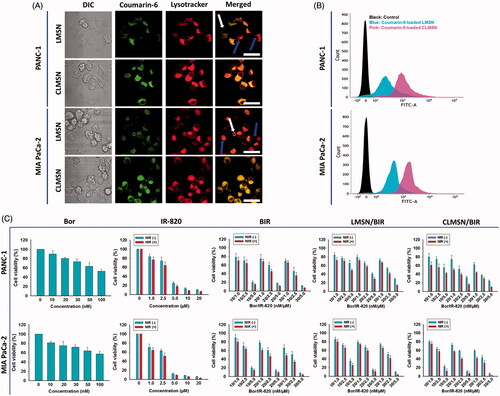
Figure 5. (A) FACS analyzes for determination of intracellular ROS production and (B) live/dead staining assay for determination of the effect of Bor, IR-820, BIR, LMSN/BIR, and CLMSN/BIR treatments on PANC-1 and MIA PaCa-2 cells with or without NIR (808 nm, 3.0 W/cm2, 5 min) laser exposure. Live cells were stained green with acridine orange and dead cells were stained red with propidium iodide; scale bar: 50 µm. Please check the online version of colored figures for details.
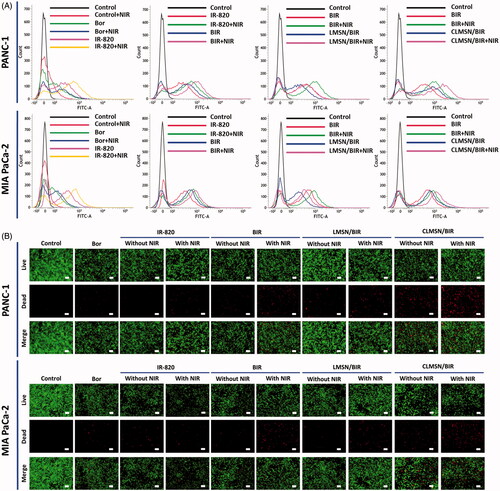
Figure 6. Determination of (A) cellular apoptosis and (B) cell migration of PANC-1 and MIA PaCa-2 cells (scale bar: 100 µm). The cells were treated with Bor, IR-820, BIR, LMSN/BIR, or CLMSN/BIR in the presence or absence of NIR exposure (808 nm, 3.0 W/cm2, 5 min).
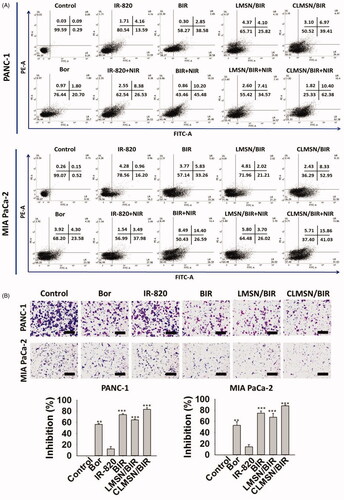
Figure 7. (A) In vivo biodistribution of Cy5.5-loaded LMSN and CLMSN in PANC-1 tumor xenograft mice. (B) Imaging and (C) evaluation of Cy5.5-loaded LMSN and CLMSN distribution in different organs after intravenous administration (*p < .05; **p < .01; ***p < .001). (D) In vivo photothermal imaging of NIR laser irradiated tumors pretreated with CLMSN/BIR formulation.
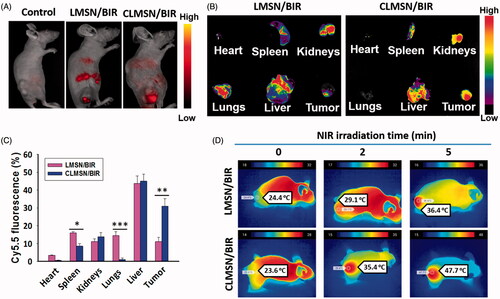
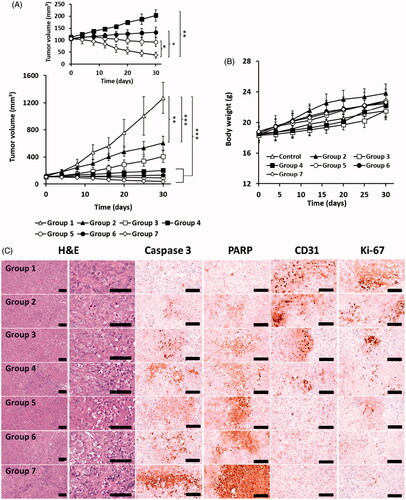
Figure 8. In vivo antitumor study: (A) tumor growth and (B) weight gain/loss profiles in PANC-1 xenograft mice after treatment. (C) Immunohistochemical evaluation of PANC-1 xenograft tumors in mice of different treatment groups. Group 1: Control, Group 2: BIR, Group 3: BIR + NIR, Group 4: LMSN/BIR, Group 5: LMSN/BIR + NIR, Group 6: CLMSN/BIR, Group 7: CLMSN/BIR + NIR (NIR exposure: 808 nm, 3.0 W/cm2, 5 min). *p < .05, **p < .01, ***p < .001. Changes in the levels of Caspase-3, PARP, CD-31 and Ki-67 expressions in tumor cells of treated groups, scale bars: 120 μm.