Figures & data
Table 1. siRNAs used in this study.
Table 2. Enhancement of cytotoxicity (%) due to complexation using 1 nM of siRNA(s) against GFR genes with NPs in MCF-7 cells. The enhancement values for NPs-siRNA(s) were compared to NPs (to confirm the effect of siRNA entrapment into complex structure).
Figure 1. (a) Size of NPs and binding interaction of negative siRNA with NPs formed with different conc. of CaCl2. NPs were formed with 1–7 mM of exogenous CaCl2 and 5 nM of AF488 negative control siRNA. (b) Cellular uptake of NPs-bound fluorescent negative siRNA. MCF-7 cells were treated with (i, ii) media (untreated), (iii, iv) NPs, (v, vi) free siRNA, and (vii, viii) NPs-siRNA formed with 3 mM of CaCl2 and 10 nM AF488 negative control siRNA. Photos were captured at 40× magnification. Upper panel-light images, bottom panel-fluorescent images. Bar indicates 20 µm scale. (c) Fluorescence intensity of intracellular components. MCF-7 cells were treated with NPs, free siRNA, and NPs-siRNA formed with 3 mM of CaCl2 and 10 nM AF488 negative control siRNA. After 6 h, fluorescence intensity of cell lysates was measured. Values are represented for duplicate samples: *p < .05 compared to NPs treatment.
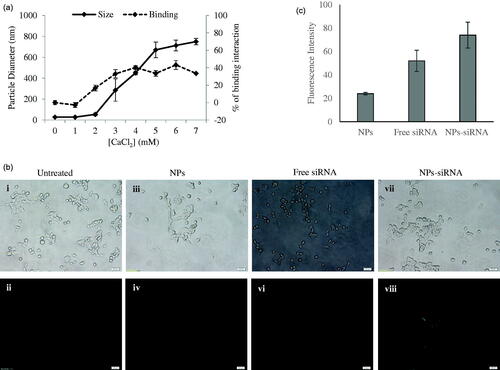
Figure 2. Effect of NPs-loaded siRNA against single gene on viability of MCF-7 cells. Cells were treated with media (untreated), NPs, and NPs-siRNA (1 nM) formed with 3 mM CaCl2. Values are represented as % of cell viability compared to untreated cells for triplicate samples. (a) NPs-negative siRNA and siRNA against; (b) egfr1; (c) erbb2; and (d) igf1r gene was used. *p < .05 compared to NPs treatment.
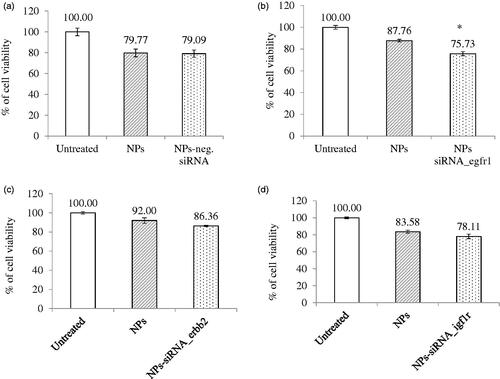
Figure 3. (a) Effect of NPs-loaded siRNA against single gene on caspase-mediated luminescence signal in MCF-7 cells. Cells were treated with media (untreated), NPs and NPs-siRNA (1 nM each siRNA against single GFR gene) formed with 3 mM of CaCl2. Data were represented as mean ± SD for duplicate samples. (b) Effect of NPs-loaded siRNAs against combination of multiple GFR genes (egfr1, erbb2, and igf1r genes) on viability of MCF-7 cells. Cells were treated with media (untreated), NPs and NPs-siRNAs (1 nM each) formed with 3 mM CaCl2. Values are represented as % of cell viability compared to untreated cells for triplicate samples. *p < .05 compared to NPs treatment.
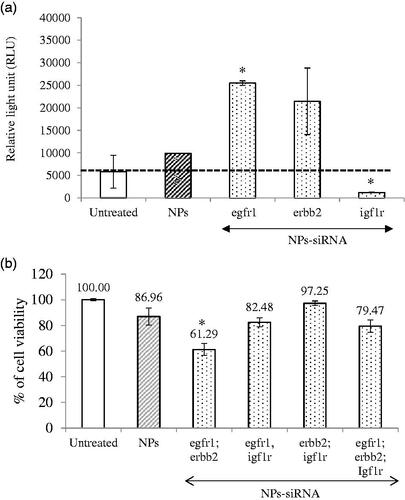
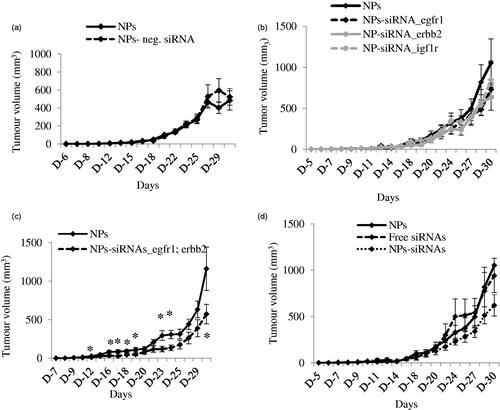
Figure 4. (a) Effect of NPs-negative siRNA on tumor outgrowth in 4T1-cells induced mouse model. Mice were treated intravenously through tail-vein injection with 100 µL of either NPs or NPs-negative siRNA (50 nM) formed with 70 mM of CaCl2. (b–d) Effect of NPs-siRNA(s) against single or multiple GFR genes on tumor outgrowth in 4T1-cells induced mouse model designed. Mice were treated intravenously through tail-vein injection with 100 µL of free/NPs-siRNA(s) formed in 70 mM of CaCl2 and 50 nM of individual siRNA(s). Tumor outgrowth of mice treated with panel (b), NPs-siRNA against single GFR gene, (c) NPs-siRNAs against egfr1 and erbb2 genes, and (d) free/NP-siRNAs against all three GFR genes. Six mice/group were used and data were represented as mean ± SD. *p < .05 compared to NPs treatment.