Figures & data
Figure 1. Structures and abbreviations for 9-[(2-phosphonomethoxy)ethyl]guanine (PMEG) and hexadecyloxypropyl 9-[(2-phosphonomethoxy)ethyl]guanine (HDP-PMEG).
![Figure 1. Structures and abbreviations for 9-[(2-phosphonomethoxy)ethyl]guanine (PMEG) and hexadecyloxypropyl 9-[(2-phosphonomethoxy)ethyl]guanine (HDP-PMEG).](/cms/asset/f3200577-1fb8-4e22-bd34-eb5c7785b78a/idrd_a_1399303_f0001_b.jpg)
Table 1. Clinical observation.
Figure 2. A. Slit-lamp photograph taken 6 weeks after 3 µg HDP-PMEG intravitreal injection, showing fine particles in vitreous (arrows) using retro illumination. B. The fundus from the same animal at the end of this study (8 weeks), showing normal optic nerve head, normal retina, and normal medullary ray.
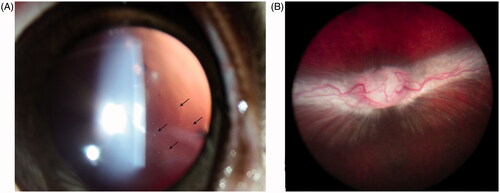
Figure 3. The box plot of ERG b-wave amplitude stratified by ERG types and the doses of HDP-PMEG. ctrl = control, L = low doses, M = middle doses, and H = high doses.
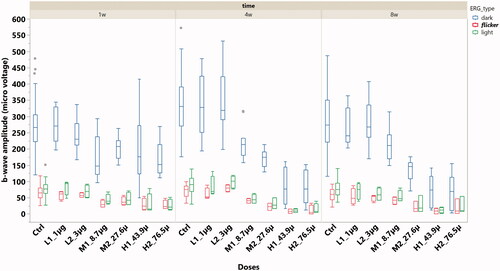
Figure 4. The mean PVR grading with one standard deviation from the eyes injected with HDP-PMEG (red) or BSS (blue) at the different exam time points. *: Indicate statistically significant with p < .05; **: Indicate statistically significant with p ≤ .01.
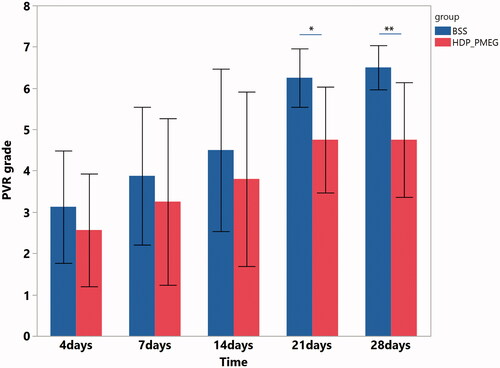
Figure 5. The distribution of the leakage grades of laser burns over leakage intensity and the groups, assessed at 2 weeks following the laser and intravitreal HDP-PMEG (CTRL = control; Tx = treatment with HDP-PMEG).
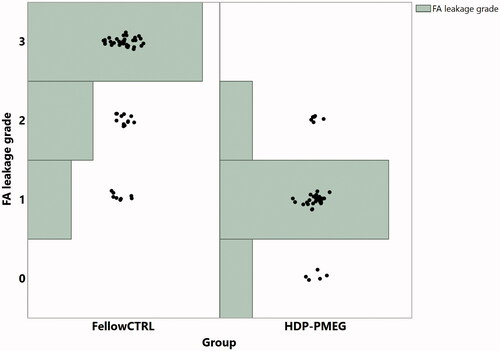
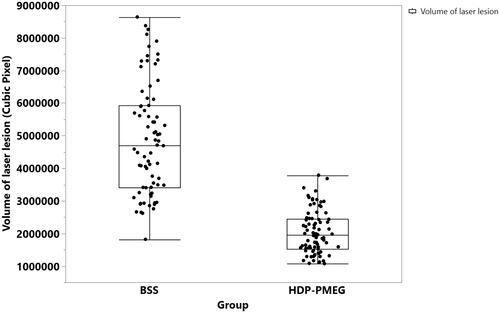
Figure 6. The distribution of the laser lesions volumes and the mean volumes with one standard deviation stratified by the groups.