Figures & data
Scheme 1. Illustration of reduction-responsive shell-sheddable PEtOz-SS-PCL micelles for triggered DOX delivery in vivo. (i) The micelles are assembled from block copolymers PEtOz-SS-PCL; (ii) DOX-loaded micelles efficiently accumulate in C6 glioma tumor; (iii) DOX is quickly released into the cytoplasm triggered by reduction stimuli.
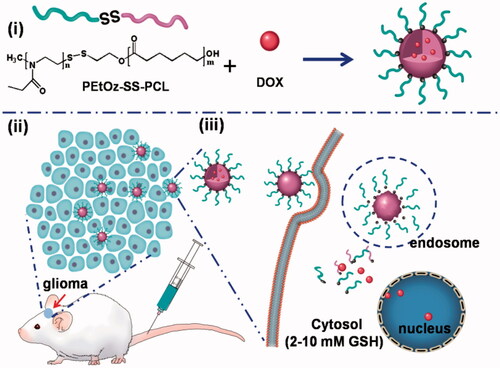
Figure 1. 1HNMR spectra (400 MHz, CDCl3) of PEtOz-SS-PCL23 (A), PEtOz-SS-PCL33 (B) and PEtOz-SS-PCL43 (C).
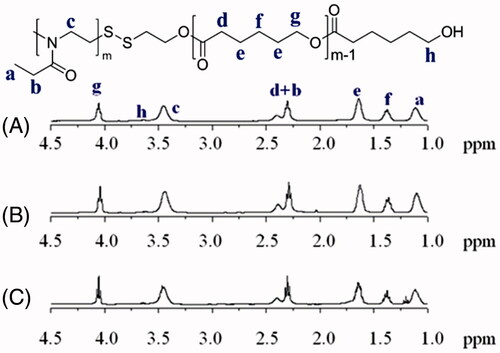
Figure 2. Characteristics of PEtOz-SS-PCL micelles. (A) TEM reveals the morphological structure of PEtOz-SS-PCL43 micelles. (B) Cellular uptake of DOX-loaded PEtOz-SS-PCL23, PEtOz-SS-PCL33 and PEtOz-SS-PCL43 micelles. (C) Reduction-triggered drug release from DOX-loaded PEtOz-SS-PCL43 micelles.
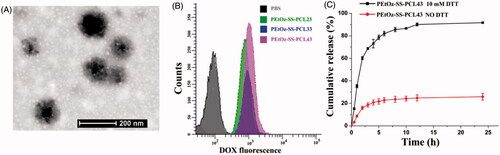
Table 1. Molecular characteristics of PEtOz-SS-PCL.
Figure 3. Antiglioma activity of DOX-loaded PEtOz-SS-PCL micelles and free DOX as a function of DOX dosages. The C6 cells were incubated with DOX-loaded micelles or free DOX for 48 h. Means ± SD (n = 6).
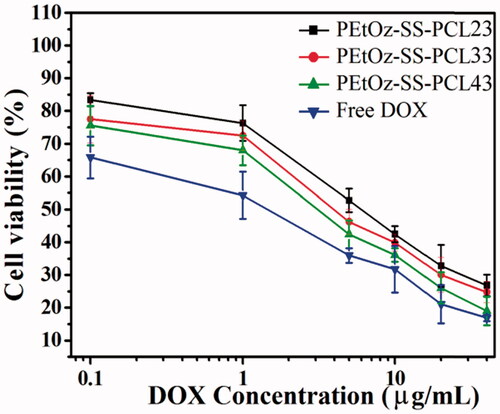
Figure 4. DOX distribution in the glioma after intravenous injection to mice with either free DOX or DOX-loaded PEtOz-SS-PCL micelles. (A) Bioluminescence of luciferase expressing tumor cells 10 min after ip injection of luciferin solution. (B) Fluorescence image of free DOX and DOX-loaded PEtOz-SS-PCL micelles in an removal of the mice brains. (C) The quantitative analysis of DOX in excised mice brains. (D) Fluorescent microscope images show the distribution of DOX in glioma after intravenous injection of free DOX and DOX-loaded PEtOz-SS-PCL micelles. Scale bar: 200 mm. G: Glioma; N: Normal brain tissues. The dashed line = boundary of the glioma. (E) Fluorescent image of tissues distribution of free DOX and DOX-loaded PEtOz-SS-PCL micelles (at DOX concentration 3 mg kg−1) were intravenously injected to C6-Luci bearing ICR mice and quantitative analysis of DOX in tissue.
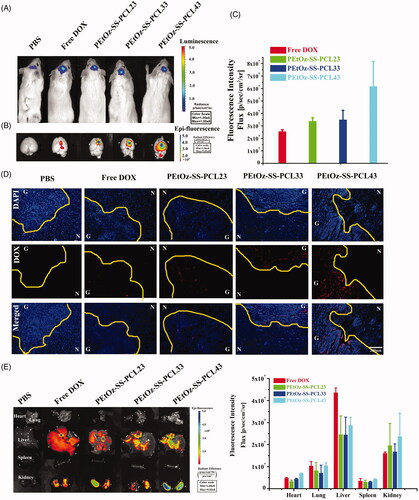
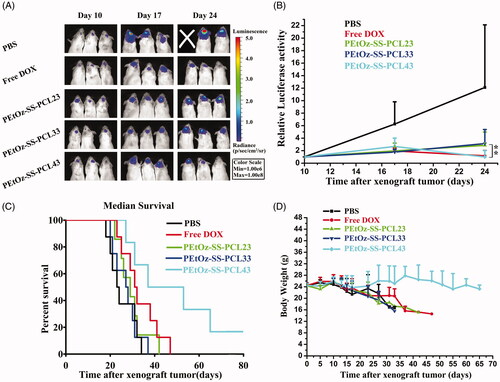
Figure 5. In vivo efficacy in C6-Luci glioma model in mice. C6-Luci-bearing mice received three injections of PBS, Free DOX, DOX-loaded PEtOz-SS-PCL23, DOX-loaded PEtOz-SS-PCL33 and DOX-loaded PEtOz-SS-PCL43 at a dose of 3 mgkg−1 DOX. (A) Bioluminescent signal change correlating to tumor growth over time following inoculation. (B) Quantification of the tumor bioluminescence signal (n = 5 mice per group). (C) Kaplan–Meier survival curve of the mice. Data are presented as Mean ± SD (n = 8, **p<.01). (D) Body weight change.