Figures & data
Figure 1. TEM image and photographs of Mag-AL/ATCOL complexes. (A) Magnetic anionic liposomes/atelocollagen (Mag-AL/ATCOL) complexes constructed using 5 µg lipid/mL of ATCOL were observed by TEM with negative staining. Scale bar, 100 nm. (B) Mag-AL/ATCOL complexes were prepared by mixing Mag-AL (final concentration at 10 µg lipid/mL) with various concentrations of ATCOL (final concentration at 1–80 µg/mL). The complexes were stored at 4 °C or 37 °C, and observed at 0, 1, 2, 4, and 24 h after preparation. Black arrows indicate aggregation.
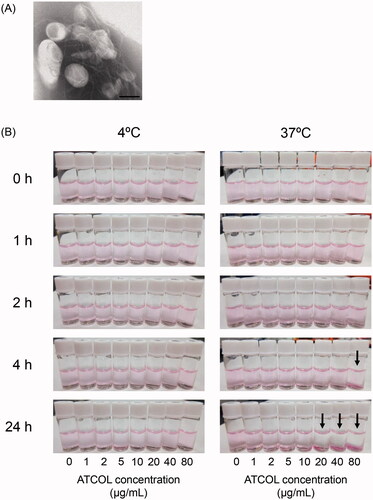
Table 1. Particle sizes and ζ-potentials of magnetic anionic liposome/atelocollagen (ATCOL) complexes.
Figure 2. Cellular association and cytotoxicity of Mag-AL/ATCOL complexes in RAW264 cells. Effect of ATCOL concentration on the cellular association and/or uptake of Mag-AL/ATCOL complexes (A) and the cell viability of RAW264 cells (B). A total of 10 µg lipid/mL of the complexes was added to each well, and incubated for 30 min at 37 °C in the presence or absence of a magnetic field. Each value represents the mean + SD (n = 4). Liposome concentration-dependent cellular association and/or uptake of Mag-AL/ATCOL complexes in RAW264 cells (C,D). Mag-AL/ATCOL complexes constructed at a mixing concentration ratio of 2:1 (Mag-AL:ATCOL) (C), and the complexes constructed using a fixed concentration of ATCOL (5 µg/mL) (D) were added to each well, and incubated for 30 min at 37 °C in the presence or absence of a magnetic field. Each value represents the mean ± SD (n = 4). **p ≤ .01, compared with the corresponding group with no magnetic field. ††p≤.01, compared with Mag-AL (ATCOL: 0 µg/mL) with a magnetic field.
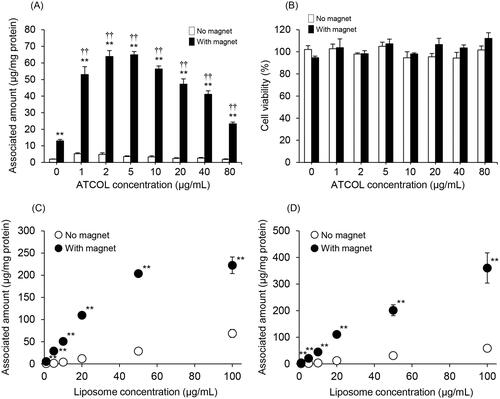
Figure 3. Comparison of the cytotoxicity and cellular association of Mag-AL/ATCOL complexes and Mag-CL. The cell viability of RAW264 cells incubated with Mag-AL/ATCOL complexes (A) and Mag-CL (B) for 30 min at 37 °C in the presence or absence of a magnetic field was assessed. Each value represents the mean + SD (n = 4). *p<.05; **p<.01, compared with the corresponding control group. Cellular association and/or uptake of the complexes (C) and Mag-CL (D) in RAW264 cells. One µg lipid/mL of the complexes or Mag-CL was added to each well, and incubated for 30–120 min at 4 °C or 37 °C in the presence of a magnetic field. Each value represents the mean ± SD (n = 4). *p<.05; **p<.01, compared with the corresponding group at 4 °C. (E) The effect of serum on the cellular association of Mag-AL/ATCOL complexes in RAW264 cells. A total of 10 µg lipid/mL of Mag-AL, Mag-AL/ATCOL complexes, and Mag-CL were incubated with 20% FBS for 30 min at 37 °C. Then, the liposomes were added to the well, and incubated for 30 min at 37 °C in the presence of a magnetic field. The complexes were constructed using a fixed concentration of ATCOL (5 µg/mL). **p<.01, compared with the corresponding non-FBS group.
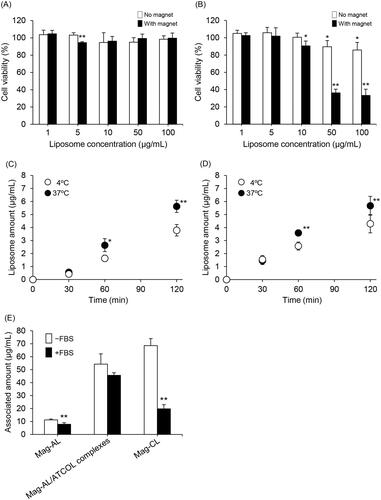
Figure 4. Cellular association and cytotoxicity of DXR-loaded Mag-AL/ATCOL complexes in CT-26 cells. (A) Release profile of DXR from Mag-AL/ATCOL complexes constructed using 5 µg/mL of ATCOL in PBS at 37 °C. (B) Representative fluorescent images of cellular association of DXR-loaded Mag-AL/ATCOL complexes in CT-26 cells. A total of 10 µg lipid/mL of the complexes was added to each well and incubated for 60 min at 37 °C in the presence or absence of a magnetic field. Scale bar, 10 µm. (C) Cell viability of CT-26 cells incubated with DXR-loaded Mag-AL/ATCOL complexes for 60 min at 37 °C in the presence or absence of a magnetic field. Each value represents the mean ± SD (n = 4).
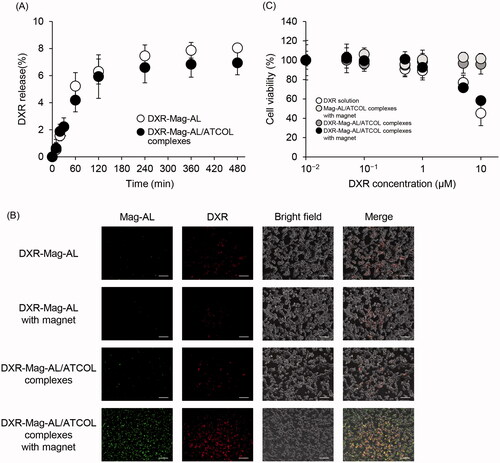
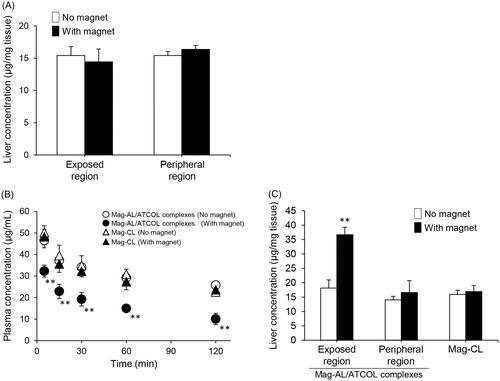
Figure 5. Plasma concentration–time profile and liver distribution of Mag-AL/ATCOL complexes after intravenous injection in rats. Liver accumulation of Mag-AL/ATCOL complexes constructed using 5 µg/mL of ATCOL (A), plasma concentration–time profile (B), and liver accumulation (C) of the complexes constructed using 10 µg/mL of ATCOL, and Mag-CL. The complexes or Mag-CL (400 µg of lipid) were intravenously injected into rats. Each value represents the mean + SD (n = 3). **p<.01, compared with the corresponding group with no magnetic field.