Figures & data
Figure 1. Schematic fabrication of HA grafted PEI-PLGA NPs for plasmid co-delivery of GA and TRAIL.
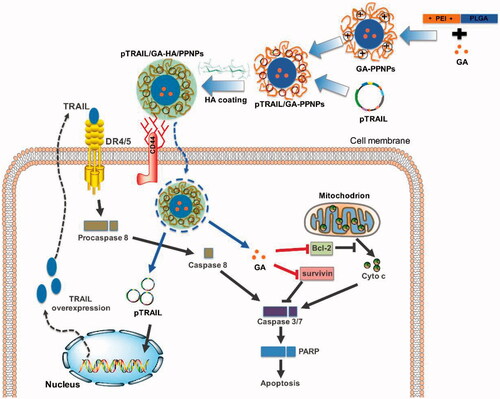
Figure 2. Preparation and characterization of GA and pTRAIL co-loaded HA/PPNPs. (A) Optimization of charge ratios (N/P) between pTRAIL and PPNPs was visualized by gel electrophoresis. Size distribution and particle morphology was measured by dynamic light scattering (B) and transmission electron microscopy (C).
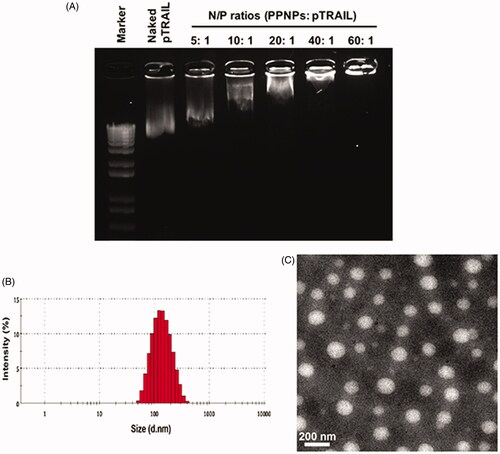
Table 1. Characterization of GA and pTRAIL loaded HA/PPNPs (n = 3).
Figure 3. Intracellular uptake of HA/PPNPsin MDA-MB-231 cells. MDA-MB-231 (A) and MCF-7 (B) cells were incubated with nile red, naked YOYO1-pTRAIL, or nile red-and YOYO1-pTRAIL co-loaded HA/PPNPs with or without the pretreatment of 1 mg/ml of HA for 4 h, and the intracellular accumulation of nile red and YOYO1-pTRAIL was observed by the Incell Analyzer 2000 (GE Healthcare). (C) MDA-MB-231and MCF-7cellswere treated as described above and the intracellular fluorescence intensity was measured by flow cytometry. Data were expressed as the mean ± SEM of three independent experiments. *p < .05 and **p < .01.
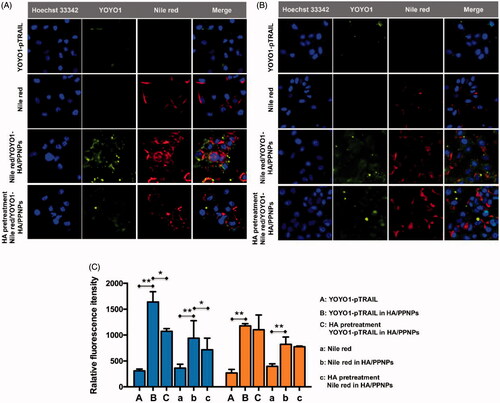
Figure 4. Cell viability of breast cancer cells after treatment with different formulations of GA and pTRAIL. MDA-MB-231 and MCF-7 cells were treated with different formulations of GA and pTRAIL for 24 h and 48 h. Cells viability was determined by MTT assay and compared to untreated cells. Data were expressed as the mean ± SEM of three independent experiments.
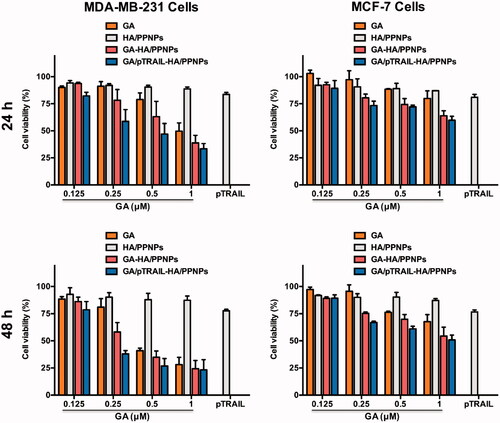
Figure 5. Cell apoptosis assay in TNBC cells. (A) Cell apoptosis was analyzed by flow cytometry using Annexin V-FITC/PI double staining. Involvement of caspase3/7 (B) and caspase 8 (C) activation. (D) Western blot analysis of apoptosis-related protein expression using indicated antibodies. Each value represents the mean ± SEM from triplicate determinations. *p < .05, **p < .01 and ***p < .001.
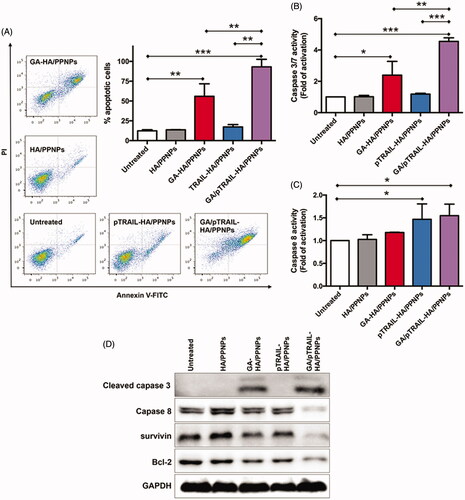
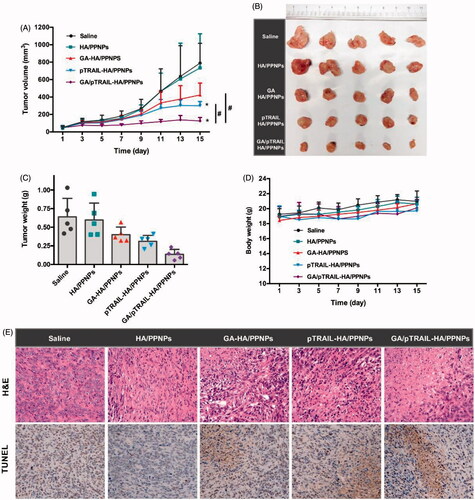
Figure 6. In vivo anti-tumor effect of GA/pTRAIL-HA/PPNPs. (A) Change of tumor volume in 4T1 cell-bearing mice after intravenous injection of different formulations. #p < .05 and *p < .05 vs. saline control. (B) Images of excised tumors of all groups at the end of study. (C) Change of body weight in 4T1-bearing mice during the study. (D) Tumor weight measured at the end of study (15 days post the initiation of treatment). Points are presented as mean ± SEM (n = 5). (E) The excised tumors of all groups were fixed and subjected to H&E histological staining and TUNEL immunohistochemical staining. Magnification ×400.