Figures & data
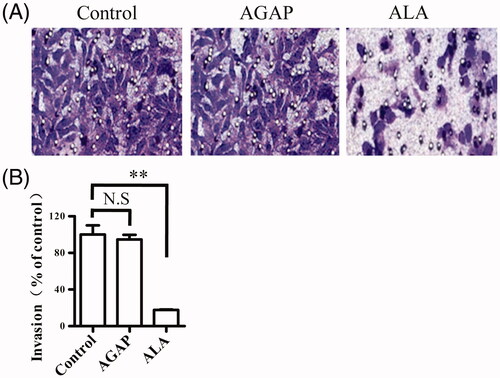
Figure 1. Recombinant expression strategy of ALA fusion protein. (A) Schematic representation of ALA fusion protein. The fusion protein ALA includes the ATF domain, the AGAP peptide, a (GS)4 linker, two uPAcleavable sites and a C-terminal Myc-tag and His6-tag. (B) Full amino acid sequence of ALA. The ATF sequence is marked in red; the AGAP sequence is marked in green. (C) Schematic map of the construction of the recombinant expression vector pPICZαA-ALA.
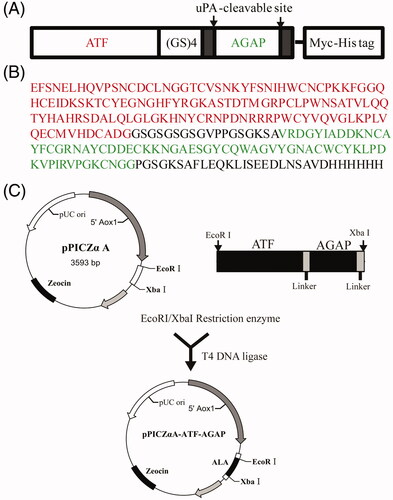
Figure 2. Expression and purification of ALA. (A) 12% SDS-PAGE analysis of the purification of fusion protein by NI-NTA affinity chromatography. Lane 1, protein molecular weight marker; Lane 2, supernatant of the ALA transformants after induction by 1.0% methanol for 24 h; Lane 3, supernatant postbiding to Ni-NTA resin; Lane 4-6, imidazole eluted fraction. (B) Western blotting analysis of ALA with mouse anti-Myc antibody.
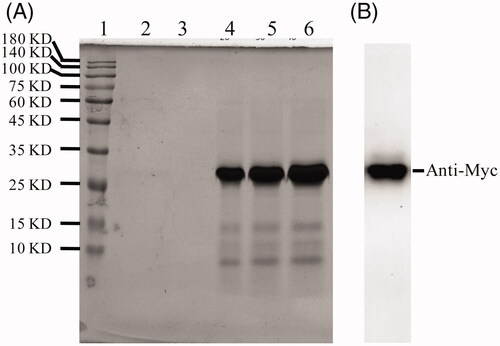
Figure 3. ALA selective binding to MDA-MB231 cells. HEK-293 or MDA-MB231 cells were treated with 10 ug/ml ALA for 4 h and then fixed in 4% paraformaldehyde. The ALA was detected by using an anti-Myc antibody and fluorescein-labeled secondary antibody. Green fluorescence shows ALA fusion protein exhibited specific affinity to MDA-MB-231 cells and mainly located on the surface.
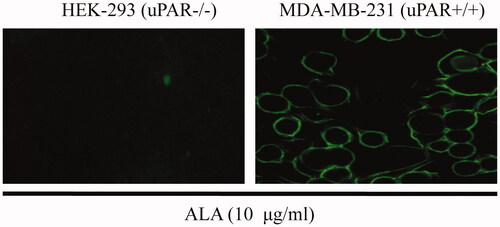
Figure 4. Tumor-selective activation of ALA. (A) The growth curves of different cell types treated by ALA. The human breast cancer cell lines MDA-MB-231 and MCF-7, human embryonic kidney cell line HEK-293 and normal human liver cell line L02 were treated with the indicated concentrations of ALA for 48 h, and then, the cell viability was measured by MTT assay. (B) 16%Tris-tricine SDS-PAGE analysis of the ALA cleavage and release of AGAP. Lane 1, protein molecular weight marker; Lane 2-4, 5 ug/ml, 10 ug/ml and 20 ug/ml ALA added to HEK-293 cell culture medium for 24 h; Lane 5-7, 5 ug/ml ALA incubated with MDA-MB-231 cell culture medium for 12 h, 24 h and 36 h, respectively. (C) The inhibition effects of ALA on different cancer cells. Cells were treated with 10 ug/ml ALA for 48 h, and then, the cell viability was measured by MTT assay.
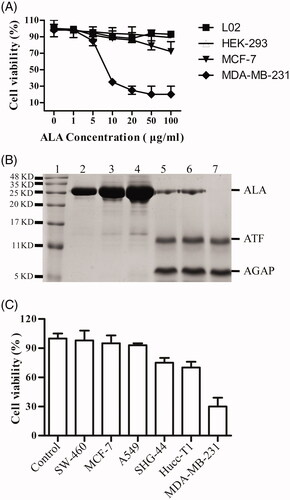
Figure 5. Effects of ALA on cell apoptosis in MDA-MB-231 cells. (A) Breast cancer cells MDA-MB-231 were treated with 0.3 uM ALA or AGAP for 36 h, and then, the apoptotic cells as percentages of total cells measured by AnnV/PI fluorescence staining and flow cytometric analysis. (B) Quantification of the apoptotic rate in (A). (C) Expression of apoptosis regulatory proteins, bax, bcl-2 and cleaved-caspase3, were determined using Western blot analysis. GAPDH levels are used as loading controls. Data are expressed as the mean ± S.D. of three experiments. *p < .05 indicates statistically significant differences from control cells.
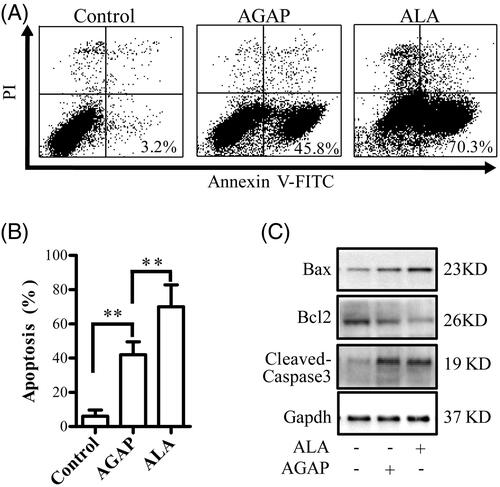
Figure 6. Effects of ALA on migration in breast cancer cells MDA-MB-231. (A) Representative micrographs of transwell migration assay. The cells passing through the matrigel basement membrane of transwell chambers were stained by crystal violet, and the staining cells represent the invasion ability of cells. (B) Quantification of cell migration expressed as the percentage of control. Data are expressed as the mean ± S.D. of three experiments. **p < .01 indicates statistically significant differences from control cells. N.S, no significance.