Figures & data
Figure 1. Particle size distribution (A), TEM morphology (B), and appearance (C) of TPR-NPs prepared from the optimal formulation.
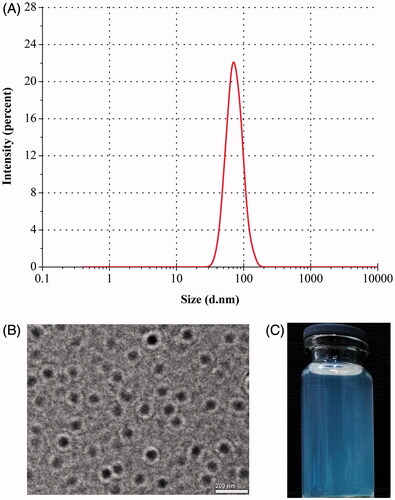
Figure 2. Release profiles of TPR from solution, suspensions and TPR-NPs determined by the reverse bulk equilibrium dialysis method (n = 3, mean ± SD).
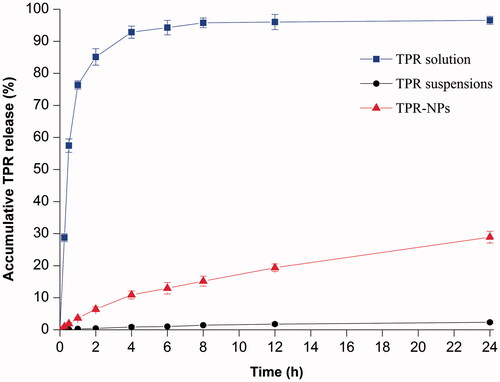
Figure 3. Cell viability of LNCaP cells after treatment with TPR solution, blank NPs, TPR-NPs, and NPs/TPRNPs for 24 h at different concentrations besides blank NPs.
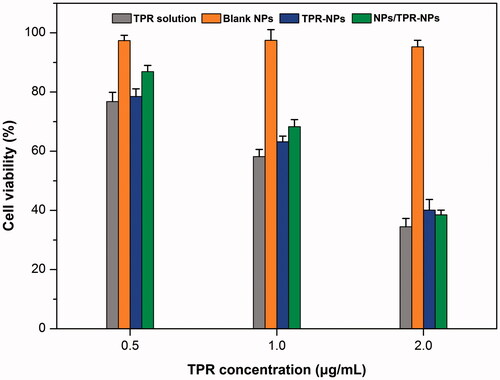
Figure 4. Pharmacokinetic profiles of TPR in rats after intravenous injection of TPR solution, TPR-NPs, and NPs/TPR-NPs (preinjection of blank NPs followed by injection of TPR-NPs). Data expressed as mean ± SD (n = 5).
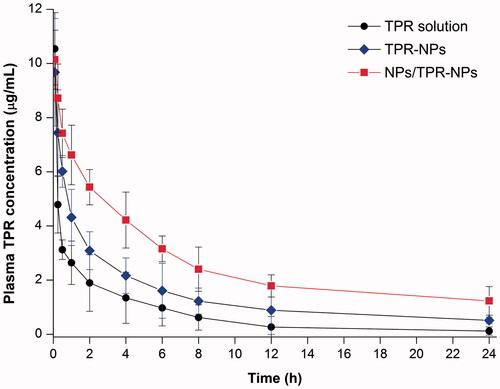
Figure 5. Tissue distribution of TPR in tumor-bearing mice at 1 and 8 h after injection of TPR solution, TPRNPs or NPs/TPR-NPs. Data shown as mean ± SD (n = 5).
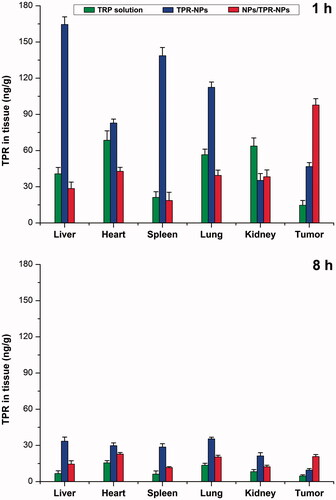
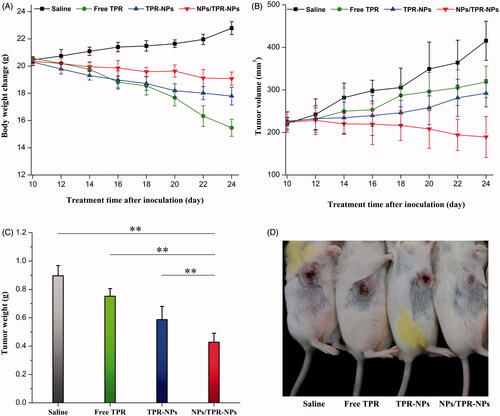
Figure 6. In vivo antitumor effects of free TPR, TPR-NPs, and NPs/TPR-NPs in LNCaP tumor xenograft mice: (A) body weight changes of mice with the treatment time; (B) tumor volume changes of mice with the treatment time; (C) average tumor weight at the end of experiment (ANOVA, **p < .01, compared with saline, free TPR, TPR-NPs, and NPs/TPR-NPs); (D) Typical mice with developed tumor after treatment for 14 d.